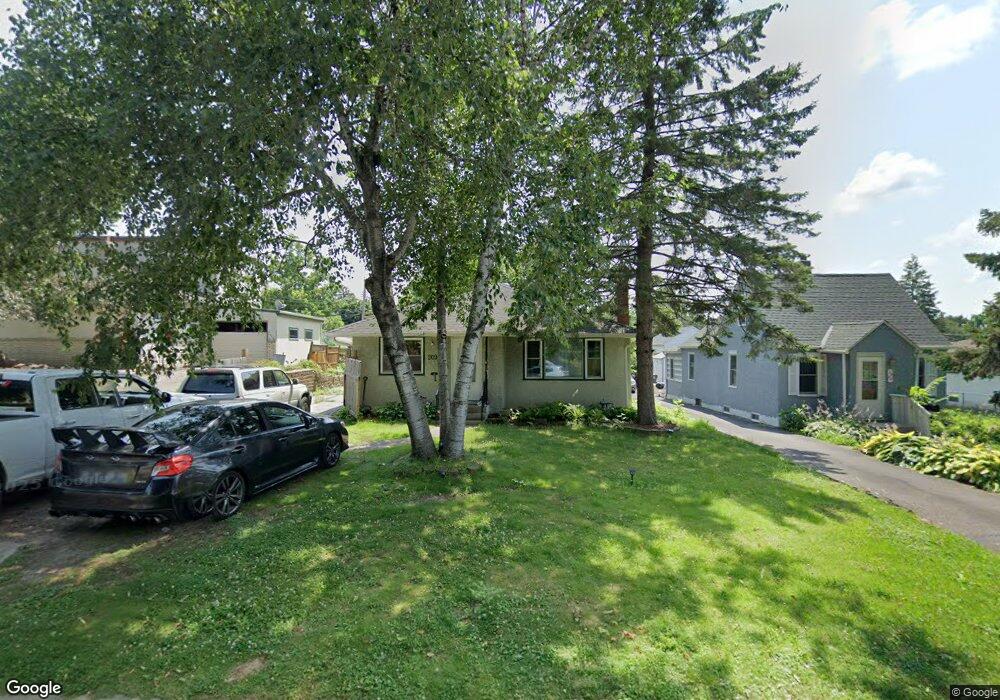
2090 Arlington Ave E Saint Paul, MN 55119
Southern Hayden Heights NeighborhoodEstimated Value: $237,416 - $258,000
2
Beds
2
Baths
664
Sq Ft
$369/Sq Ft
Est. Value
About This Home
This home is located at 2090 Arlington Ave E, Saint Paul, MN 55119 and is currently estimated at $245,104, approximately $369 per square foot. 2090 Arlington Ave E is a home located in Ramsey County with nearby schools including The Heights Community School, Txuj Ci HMong Language and Culture Upper Campus, and Johnson Senior High School.
Ownership History
Date
Name
Owned For
Owner Type
Purchase Details
Closed on
Oct 17, 2017
Sold by
Crowell Steven Prentice and Crowell Sophie Marie
Bought by
Sosa Morales Kevin A
Current Estimated Value
Home Financials for this Owner
Home Financials are based on the most recent Mortgage that was taken out on this home.
Original Mortgage
$164,803
Outstanding Balance
$137,694
Interest Rate
3.83%
Mortgage Type
New Conventional
Estimated Equity
$107,410
Purchase Details
Closed on
Aug 24, 2015
Sold by
Centeno Osbaldo Osbaldo
Bought by
Crowell Stevan Stevan
Home Financials for this Owner
Home Financials are based on the most recent Mortgage that was taken out on this home.
Original Mortgage
$138,700
Interest Rate
3.93%
Purchase Details
Closed on
Oct 24, 2003
Sold by
Benson Nathan M
Bought by
Lemle Barbara A
Purchase Details
Closed on
Aug 16, 2001
Sold by
Courteau Claudia Jean and Courteau William J
Bought by
Benson Nathan M
Create a Home Valuation Report for This Property
The Home Valuation Report is an in-depth analysis detailing your home's value as well as a comparison with similar homes in the area
Home Values in the Area
Average Home Value in this Area
Purchase History
| Date | Buyer | Sale Price | Title Company |
|---|---|---|---|
| Sosa Morales Kevin A | $169,900 | Title Specialists | |
| Crowell Stevan Stevan | $141,700 | -- | |
| Lemle Barbara A | $174,500 | -- | |
| Benson Nathan M | $133,000 | -- |
Source: Public Records
Mortgage History
| Date | Status | Borrower | Loan Amount |
|---|---|---|---|
| Open | Sosa Morales Kevin A | $164,803 | |
| Previous Owner | Crowell Stevan Stevan | $138,700 |
Source: Public Records
Tax History Compared to Growth
Tax History
| Year | Tax Paid | Tax Assessment Tax Assessment Total Assessment is a certain percentage of the fair market value that is determined by local assessors to be the total taxable value of land and additions on the property. | Land | Improvement |
|---|---|---|---|---|
| 2025 | $3,590 | $243,700 | $30,000 | $213,700 |
| 2023 | $3,590 | $218,400 | $25,000 | $193,400 |
| 2022 | $3,232 | $242,400 | $25,000 | $217,400 |
| 2021 | $2,918 | $203,300 | $25,000 | $178,300 |
| 2020 | $2,684 | $188,500 | $22,800 | $165,700 |
| 2019 | $2,656 | $164,200 | $22,800 | $141,400 |
| 2018 | $2,308 | $160,500 | $22,800 | $137,700 |
| 2017 | $1,956 | $156,600 | $22,800 | $133,800 |
| 2016 | $1,840 | $0 | $0 | $0 |
| 2015 | $1,780 | $130,500 | $22,800 | $107,700 |
| 2014 | $1,694 | $0 | $0 | $0 |
Source: Public Records
Map
Nearby Homes
- 2069 Sherwood Ave
- 2112 Cottage Ave E
- 2027 Cottage Ave E
- 1964 Arlington Ave E
- 2032 Hyacinth Ave E
- 1427 Hazel St N
- 1976 Orange Ave E
- 1874 Hoyt Ave E
- 1250 Mcknight Rd N
- 1844 Montana Ave E
- 1840 Hoyt Ave E
- 1806 Sherwood Ave
- 1840 Iowa Ave E
- 2225 Larpenteur Ave E
- 2317 Arlington Ave E
- 1742 Howard St N
- 1311 White Bear Ave N
- 1779 Orange Ave E
- 1568 Lakewood Dr N
- 2401 Bison Dr
- 2096 Arlington Ave E
- 2084 Arlington Ave E
- 2084 2084 Arlington-Avenue-e
- 2078 Arlington Ave E
- 2100 Arlington Ave E
- 2093 Sherwood Ave
- 2097 Sherwood Ave
- 2097 2097 Sherwood-Avenue-
- 2083 Sherwood Ave
- 2072 Arlington Ave E
- 2103 Sherwood Ave
- 2079 Sherwood Ave
- 2110 Arlington Ave E
- 2085 Arlington Ave E
- 2099 Arlington Ave E
- 2109 Sherwood Ave
- 2066 Arlington Ave E
- 2077 Arlington Ave E
- 2109 Arlington Ave E
- 2116 Arlington Ave E