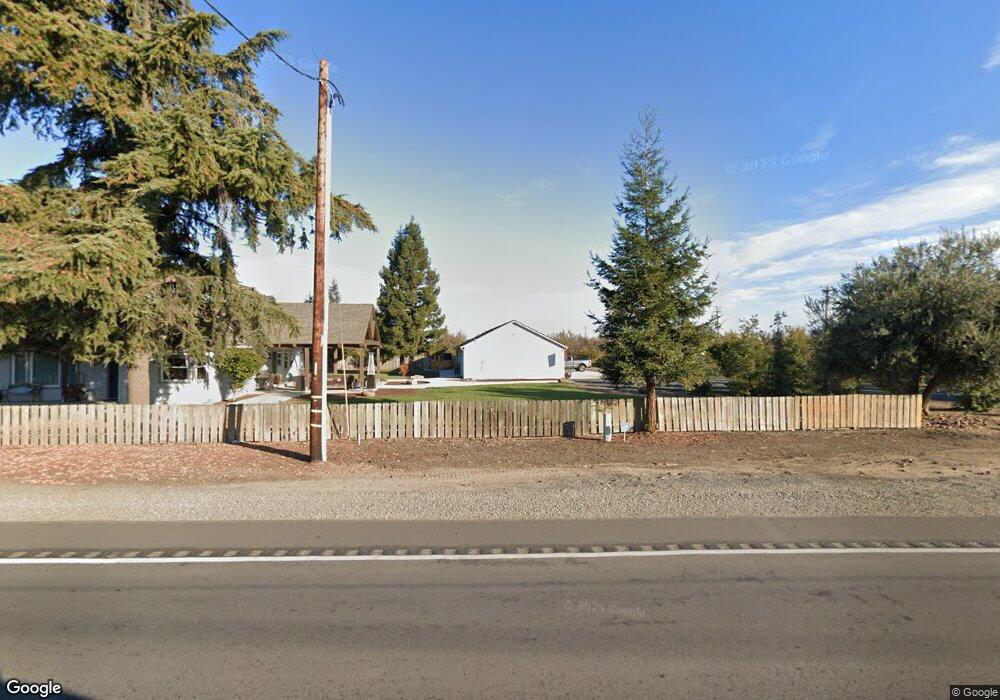
20921 E River Rd Escalon, CA 95320
Estimated Value: $773,000 - $1,056,000
3
Beds
2
Baths
1,752
Sq Ft
$552/Sq Ft
Est. Value
About This Home
This home is located at 20921 E River Rd, Escalon, CA 95320 and is currently estimated at $966,992, approximately $551 per square foot. 20921 E River Rd is a home located in San Joaquin County with nearby schools including Colony Oak Elementary School, Park View Elementary School, and Ripona Elementary School.
Ownership History
Date
Name
Owned For
Owner Type
Purchase Details
Closed on
Dec 20, 2016
Sold by
Betschart Julie Ann
Bought by
Betschart Julie A
Current Estimated Value
Purchase Details
Closed on
Jul 31, 2014
Sold by
Chapin James M
Bought by
Betschart Julie Ann
Home Financials for this Owner
Home Financials are based on the most recent Mortgage that was taken out on this home.
Original Mortgage
$300,000
Outstanding Balance
$228,835
Interest Rate
4.12%
Mortgage Type
Unknown
Estimated Equity
$738,157
Purchase Details
Closed on
Apr 28, 2008
Sold by
Chapin James M and Chapin Julie A
Bought by
Chapin James M and Chapin Julie A
Purchase Details
Closed on
Jun 26, 2000
Sold by
Yarborough Jack A
Bought by
Chapin James M and Chapin Julie A
Home Financials for this Owner
Home Financials are based on the most recent Mortgage that was taken out on this home.
Original Mortgage
$250,000
Interest Rate
8.63%
Create a Home Valuation Report for This Property
The Home Valuation Report is an in-depth analysis detailing your home's value as well as a comparison with similar homes in the area
Purchase History
| Date | Buyer | Sale Price | Title Company |
|---|---|---|---|
| Betschart Julie A | -- | None Available | |
| Betschart Julie Ann | -- | Placer Title Company | |
| Betschart Julie Ann | -- | Placer Title Company | |
| Chapin James M | -- | None Available | |
| Chapin James M | $325,000 | Old Republic Title Company |
Source: Public Records
Mortgage History
| Date | Status | Borrower | Loan Amount |
|---|---|---|---|
| Open | Betschart Julie Ann | $300,000 | |
| Closed | Chapin James M | $250,000 |
Source: Public Records
Tax History
| Year | Tax Paid | Tax Assessment Tax Assessment Total Assessment is a certain percentage of the fair market value that is determined by local assessors to be the total taxable value of land and additions on the property. | Land | Improvement |
|---|---|---|---|---|
| 2025 | $6,626 | $572,069 | $268,079 | $303,990 |
| 2024 | $6,469 | $560,853 | $262,823 | $298,030 |
| 2023 | $6,250 | $549,856 | $257,670 | $292,186 |
| 2022 | $6,061 | $539,076 | $252,618 | $286,458 |
| 2021 | $6,049 | $528,506 | $247,665 | $280,841 |
| 2020 | $5,996 | $523,088 | $245,126 | $277,962 |
| 2019 | $5,812 | $504,833 | $240,320 | $264,513 |
| 2018 | $5,496 | $473,597 | $235,608 | $237,989 |
| 2017 | $5,394 | $464,312 | $230,989 | $233,323 |
| 2016 | $5,020 | $439,032 | $226,461 | $212,571 |
| 2014 | $4,588 | $408,091 | $208,959 | $199,132 |
Source: Public Records
Map
Nearby Homes
- 20339 Sexton Rd
- 7434 River Nine Dr
- 7443 River Nine Dr
- 0 Country Club Dr Unit 225133752
- 1319 Trey Way
- 17751 Sexton Rd
- 600 Atherton Ct
- 808 Country Club Dr
- 606 Hartley Dr
- 6220 Tully Rd
- 22451 California 120
- 22095 State Highway 120
- 18650 E Eugenia Ave
- 1720 Fairway Oaks Ct
- 5706 Finney Rd
- 495 Valdapena Way
- 1234 Murphy Rd
- 2345 Murphy Rd
- 1737 Sanchez Way
- 4901 Sun Brook Dr
- 21296 E River Rd
- 21279 E River Rd
- 21335 E River Rd
- 21264 E River Rd
- 21423 E River Rd
- 21048 E River Rd
- 21664 E River Rd
- 21549 E River Rd
- 22202 S Van Allen Rd
- 21561 E River Rd
- 20848 E River Rd
- 20896 E River Rd
- 20865 E River Rd
- 21779 E River Rd
- 21744 E River Rd
- 20700 E River Rd
- 21835 S Van Allen Rd
- 20601 E River Rd
- 21520 S Van Allen Rd
- 21991 E River Rd
Your Personal Tour Guide
Ask me questions while you tour the home.