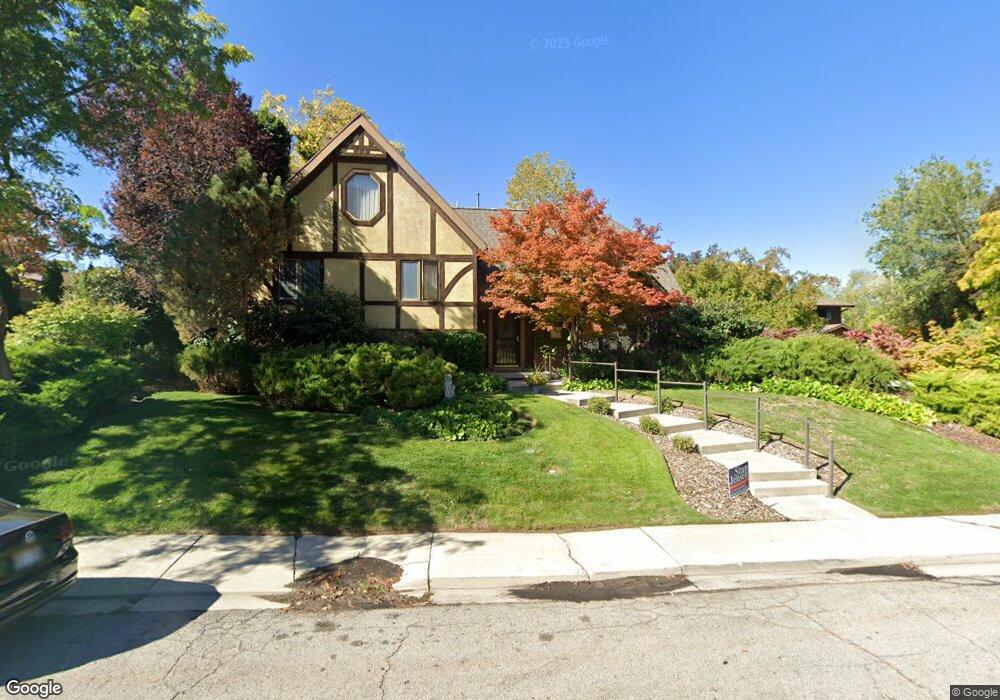
2093 N 420 E Provo, UT 84604
Rock Canyon NeighborhoodEstimated Value: $624,000 - $675,296
3
Beds
4
Baths
1,437
Sq Ft
$456/Sq Ft
Est. Value
About This Home
This home is located at 2093 N 420 E, Provo, UT 84604 and is currently estimated at $654,765, approximately $455 per square foot. 2093 N 420 E is a home located in Utah County with nearby schools including Rock Canyon Elementary School, Centennial Middle School, and Timpview High School.
Ownership History
Date
Name
Owned For
Owner Type
Purchase Details
Closed on
Jan 9, 2017
Sold by
Ashby Verel R and Ashby Cozette
Bought by
Ashby Verel R and Ashby Cozette
Current Estimated Value
Purchase Details
Closed on
Oct 24, 2011
Sold by
Ashby Verel and Ashby Cozette
Bought by
Ashby Verel R and Ashby Cozette
Home Financials for this Owner
Home Financials are based on the most recent Mortgage that was taken out on this home.
Original Mortgage
$194,000
Interest Rate
4.01%
Mortgage Type
New Conventional
Purchase Details
Closed on
Mar 10, 2004
Sold by
Ashby Verel R and Ashby Cozette
Bought by
Ashby Verel and Ashby Cozette
Home Financials for this Owner
Home Financials are based on the most recent Mortgage that was taken out on this home.
Original Mortgage
$149,600
Interest Rate
5.65%
Mortgage Type
Credit Line Revolving
Create a Home Valuation Report for This Property
The Home Valuation Report is an in-depth analysis detailing your home's value as well as a comparison with similar homes in the area
Home Values in the Area
Average Home Value in this Area
Purchase History
| Date | Buyer | Sale Price | Title Company |
|---|---|---|---|
| Ashby Verel R | -- | None Available | |
| Ashby Verel R | -- | United West Title | |
| Ashby Verel | -- | Old Republic Title Company |
Source: Public Records
Mortgage History
| Date | Status | Borrower | Loan Amount |
|---|---|---|---|
| Closed | Ashby Verel R | $194,000 | |
| Closed | Ashby Verel | $149,600 |
Source: Public Records
Tax History
| Year | Tax Paid | Tax Assessment Tax Assessment Total Assessment is a certain percentage of the fair market value that is determined by local assessors to be the total taxable value of land and additions on the property. | Land | Improvement |
|---|---|---|---|---|
| 2025 | $3,037 | $346,115 | -- | -- |
| 2024 | $3,037 | $298,980 | $0 | $0 |
| 2023 | $2,866 | $278,135 | $0 | $0 |
| 2022 | $3,291 | $321,970 | $0 | $0 |
| 2021 | $2,681 | $457,500 | $188,600 | $268,900 |
| 2020 | $2,591 | $414,500 | $150,900 | $263,600 |
| 2019 | $2,491 | $414,500 | $150,900 | $263,600 |
| 2018 | $2,253 | $380,100 | $150,900 | $229,200 |
| 2017 | $1,955 | $181,280 | $0 | $0 |
| 2016 | $1,903 | $164,450 | $0 | $0 |
| 2015 | $1,680 | $146,740 | $0 | $0 |
| 2014 | $1,446 | $131,670 | $0 | $0 |
Source: Public Records
Map
Nearby Homes
- 2254 N 390 E
- 240 E 2230 N Unit 7
- 186 E 2100 N
- 182 E 2090 N
- 1840 Sego Ln
- 360 Sumac Ln
- 2735 N Country Club Dr
- 2774 N 370 E
- 223 W 2230 N Unit 14
- 788 E 2680 N
- 241 W 2230 N Unit 16
- 264 W 1625 N
- 1108 E 2620 N
- 3025 N 250 E
- 758 E 3030 N
- 2939 N Marrcrest Dr W
- 3013 N 100 W
- 2999 N Marrcrest West Dr
- 3057 N 100 W
- 1470 N 380 W
Your Personal Tour Guide
Ask me questions while you tour the home.