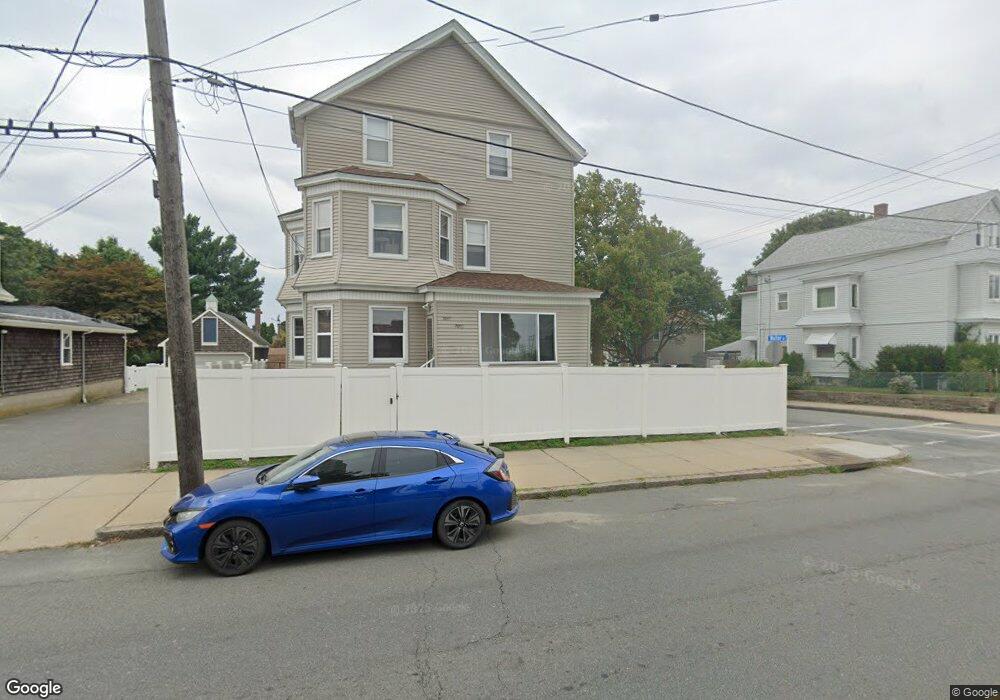
2093 S Main St Unit 2095 Fall River, MA 02724
Sandy Beach NeighborhoodEstimated Value: $467,066 - $701,000
6
Beds
3
Baths
3,707
Sq Ft
$167/Sq Ft
Est. Value
About This Home
This home is located at 2093 S Main St Unit 2095, Fall River, MA 02724 and is currently estimated at $617,517, approximately $166 per square foot. 2093 S Main St Unit 2095 is a home located in Bristol County with nearby schools including Carlton M. Viveiros Elementary School, Matthew J. Kuss Middle School, and B M C Durfee High School.
Ownership History
Date
Name
Owned For
Owner Type
Purchase Details
Closed on
Feb 3, 2015
Sold by
Ferreira Jeffrey S and Ferreira Natalie
Bought by
Grace Ft
Current Estimated Value
Purchase Details
Closed on
May 30, 1996
Sold by
Lopes Debra O
Bought by
Ferreira Jeffrey S and Ferreira Natalie
Home Financials for this Owner
Home Financials are based on the most recent Mortgage that was taken out on this home.
Original Mortgage
$89,025
Interest Rate
7.91%
Mortgage Type
Purchase Money Mortgage
Create a Home Valuation Report for This Property
The Home Valuation Report is an in-depth analysis detailing your home's value as well as a comparison with similar homes in the area
Home Values in the Area
Average Home Value in this Area
Purchase History
| Date | Buyer | Sale Price | Title Company |
|---|---|---|---|
| Grace Ft | -- | -- | |
| Ferreira Jeffrey S | $118,700 | -- |
Source: Public Records
Mortgage History
| Date | Status | Borrower | Loan Amount |
|---|---|---|---|
| Previous Owner | Ferreira Jeffrey S | $138,000 | |
| Previous Owner | Ferreira Jeffrey S | $25,000 | |
| Previous Owner | Ferreira Jeffrey S | $110,000 | |
| Previous Owner | Ferreira Jeffrey S | $89,025 |
Source: Public Records
Tax History Compared to Growth
Tax History
| Year | Tax Paid | Tax Assessment Tax Assessment Total Assessment is a certain percentage of the fair market value that is determined by local assessors to be the total taxable value of land and additions on the property. | Land | Improvement |
|---|---|---|---|---|
| 2025 | $5,848 | $510,700 | $106,400 | $404,300 |
| 2024 | $5,588 | $486,300 | $102,400 | $383,900 |
| 2023 | $5,098 | $415,500 | $84,600 | $330,900 |
| 2022 | $4,518 | $358,000 | $80,600 | $277,400 |
| 2021 | $4,254 | $307,600 | $76,700 | $230,900 |
| 2020 | $3,809 | $263,600 | $75,600 | $188,000 |
| 2019 | $3,237 | $222,000 | $72,800 | $149,200 |
| 2018 | $3,105 | $212,400 | $78,800 | $133,600 |
| 2017 | $2,922 | $208,700 | $75,100 | $133,600 |
| 2016 | $2,865 | $210,200 | $79,900 | $130,300 |
| 2015 | $2,749 | $210,200 | $79,900 | $130,300 |
| 2014 | $3,142 | $249,800 | $77,600 | $172,200 |
Source: Public Records
Map
Nearby Homes
- 15 Higgins St
- 126 Wheeler St
- 616 Woodman St
- 584-586 Mount Hope Ave
- 644-648 King Philip St
- 66 Bailey St
- 289 King Philip St
- 636-644 Dwelly St
- 579 Summit St Unit 3
- 579 Summit St Unit 2
- 321 King St
- 909 Dwelly St
- 160 Foote St
- 123 Hall St
- 24 Hall St
- 391 Clarkson St
- 20 Wilcox St
- 0 Sampson St
- 1334 S Main St
- 11 Palmer St