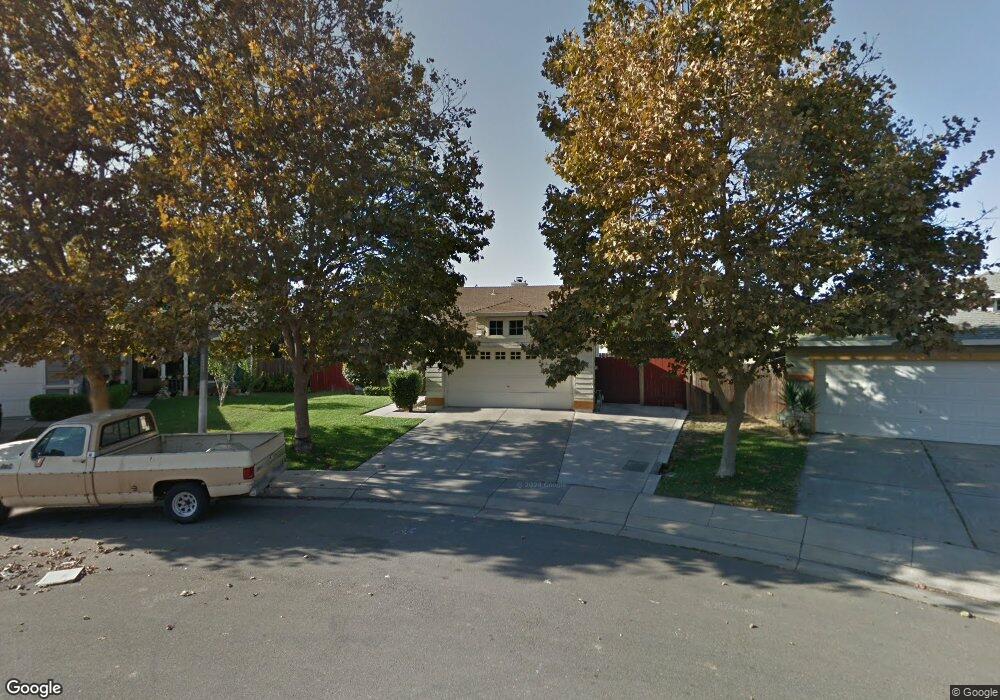
2095 Nevada St Stockton, CA 95206
Seaport NeighborhoodEstimated Value: $382,000 - $428,000
3
Beds
2
Baths
1,364
Sq Ft
$296/Sq Ft
Est. Value
About This Home
This home is located at 2095 Nevada St, Stockton, CA 95206 and is currently estimated at $403,174, approximately $295 per square foot. 2095 Nevada St is a home located in San Joaquin County with nearby schools including San Joaquin Elementary School, John Marshall Elementary School, and Taylor Leadership Academy.
Ownership History
Date
Name
Owned For
Owner Type
Purchase Details
Closed on
Aug 18, 1994
Sold by
Kaufman & Broad Central Valley Inc
Bought by
Corralejo Manuel O and Corralejo Cheryl I
Current Estimated Value
Home Financials for this Owner
Home Financials are based on the most recent Mortgage that was taken out on this home.
Original Mortgage
$108,794
Interest Rate
8.8%
Mortgage Type
FHA
Create a Home Valuation Report for This Property
The Home Valuation Report is an in-depth analysis detailing your home's value as well as a comparison with similar homes in the area
Home Values in the Area
Average Home Value in this Area
Purchase History
| Date | Buyer | Sale Price | Title Company |
|---|---|---|---|
| Corralejo Manuel O | $110,000 | -- |
Source: Public Records
Mortgage History
| Date | Status | Borrower | Loan Amount |
|---|---|---|---|
| Closed | Corralejo Manuel O | $108,794 |
Source: Public Records
Tax History
| Year | Tax Paid | Tax Assessment Tax Assessment Total Assessment is a certain percentage of the fair market value that is determined by local assessors to be the total taxable value of land and additions on the property. | Land | Improvement |
|---|---|---|---|---|
| 2025 | $5,057 | $194,146 | $58,779 | $135,367 |
| 2024 | $3,685 | $190,340 | $57,627 | $132,713 |
| 2023 | $4,107 | $186,609 | $56,498 | $130,111 |
| 2022 | $2,330 | $182,951 | $55,391 | $127,560 |
| 2021 | $3,424 | $179,364 | $54,305 | $125,059 |
| 2020 | $3,405 | $177,526 | $53,749 | $123,777 |
| 2019 | $3,309 | $174,046 | $52,696 | $121,350 |
| 2018 | $2,721 | $170,634 | $51,663 | $118,971 |
| 2017 | $2,504 | $167,289 | $50,650 | $116,639 |
| 2016 | $2,515 | $164,010 | $49,657 | $114,353 |
| 2014 | $2,397 | $158,382 | $47,953 | $110,429 |
Source: Public Records
Map
Nearby Homes
- 2041 Grey Stone Dr
- 1773 Willow Park Way
- 1711 Bella Lago Dr
- 1744 Bella Largo Dr
- 1540 Battlement Dr
- 1425 Silverbell Dr
- 1710 Crossbow Ln
- 1662 Lever Blvd
- 1638 S Argonaut St
- 864 W 5th St
- 1840 W Hazelton Ave
- 1785 W Hazelton Ave
- 2131 Watercourse St
- 1603 W Hazelton Ave
- 309 S Los Angeles Ave
- 50 S Los Angeles Ave
- 520 W Jackson St
- 544 W 9th St
- 3330 Konig Ct
- 1598 Kimiyo St
- 2011 Claycomb Way
- 2083 Nevada St
- 2076 Burney Falls Dr
- 2062 Burney Falls Dr
- 2088 Burney Falls Dr
- 2050 Burney Falls Dr
- 2025 Claycomb Way
- 2071 Nevada St
- 2036 Moncado Dr
- 2042 Moncado Dr
- 2018 Moncado Dr
- 2038 Burney Falls Dr
- 2060 Moncado Dr
- 2039 Claycomb Way
- 2049 Nevada St
- 2082 Nevada St
- 2074 Moncado Dr
- 2026 Burney Falls Dr
- 2004 Moncado Dr
- 2070 Nevada St
Your Personal Tour Guide
Ask me questions while you tour the home.