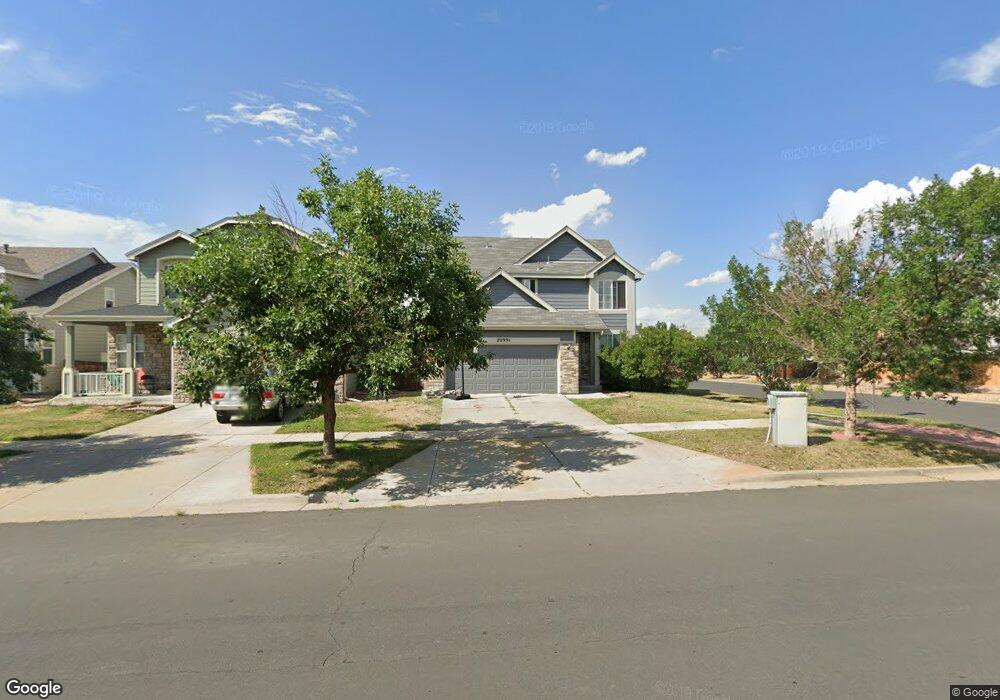
20991 E 40th Ave Denver, CO 80249
Green Valley Ranch NeighborhoodEstimated Value: $482,257 - $537,000
4
Beds
3
Baths
2,863
Sq Ft
$175/Sq Ft
Est. Value
About This Home
This home is located at 20991 E 40th Ave, Denver, CO 80249 and is currently estimated at $501,314, approximately $175 per square foot. 20991 E 40th Ave is a home located in Denver County with nearby schools including Green Valley Elementary School, Pitt-Waller K-8 School, and McGlone Academy.
Ownership History
Date
Name
Owned For
Owner Type
Purchase Details
Closed on
Feb 20, 2021
Sold by
Swain Essence and Estate Of Christopher Michael
Bought by
Swain Essence
Current Estimated Value
Purchase Details
Closed on
Aug 19, 2010
Sold by
Wells Fargo Bank Na
Bought by
Swain Christopher
Home Financials for this Owner
Home Financials are based on the most recent Mortgage that was taken out on this home.
Original Mortgage
$168,547
Outstanding Balance
$109,499
Interest Rate
4.51%
Mortgage Type
VA
Estimated Equity
$391,815
Purchase Details
Closed on
Mar 3, 2010
Sold by
Duong Oanh and Calomino James A
Bought by
Wells Fargo Bak Na
Purchase Details
Closed on
Oct 20, 2009
Sold by
Duong Oanh and Calomino James A
Bought by
Duong Oanh
Purchase Details
Closed on
Apr 17, 2002
Sold by
Duong Oanh
Bought by
Duong Oanh and Calomino James A
Home Financials for this Owner
Home Financials are based on the most recent Mortgage that was taken out on this home.
Original Mortgage
$182,476
Interest Rate
9.12%
Create a Home Valuation Report for This Property
The Home Valuation Report is an in-depth analysis detailing your home's value as well as a comparison with similar homes in the area
Home Values in the Area
Average Home Value in this Area
Purchase History
We collect this data history from publicly available records. To have your information removed, we recommend requesting removal directly through your county’s website.
| Date | Buyer | Sale Price | Title Company |
|---|---|---|---|
| Swain Essence | -- | None Available | |
| Swain Christopher | $165,000 | North American Title | |
| Wells Fargo Bak Na | -- | None Available | |
| Duong Oanh | -- | None Available | |
| Duong Oanh | -- | Land Title | |
| Duong Oanh | $202,752 | Land Title |
Source: Public Records
Mortgage History
We collect this data history from publicly available records. To have your information removed, we recommend requesting removal directly through your county’s website.
| Date | Status | Borrower | Loan Amount |
|---|---|---|---|
| Open | Swain Christopher | $168,547 | |
| Previous Owner | Duong Oanh | $182,476 |
Source: Public Records
Tax History
| Year | Tax Paid | Tax Assessment Tax Assessment Total Assessment is a certain percentage of the fair market value that is determined by local assessors to be the total taxable value of land and additions on the property. | Land | Improvement |
|---|---|---|---|---|
| 2025 | $3,480 | $38,150 | $5,080 | $5,080 |
| 2024 | $3,151 | $33,420 | $1,150 | $32,270 |
| 2023 | $2,991 | $33,420 | $1,150 | $32,270 |
| 2022 | $2,679 | $26,890 | $4,000 | $22,890 |
| 2021 | $2,621 | $27,670 | $4,120 | $23,550 |
| 2020 | $2,480 | $26,300 | $3,430 | $22,870 |
| 2019 | $2,425 | $26,300 | $3,430 | $22,870 |
| 2018 | $2,146 | $22,020 | $2,770 | $19,250 |
| 2017 | $2,141 | $22,020 | $2,770 | $19,250 |
| 2016 | $1,893 | $18,620 | $2,675 | $15,945 |
| 2015 | $1,829 | $18,620 | $2,675 | $15,945 |
| 2014 | $1,384 | $13,420 | $2,388 | $11,032 |
Source: Public Records
Map
Nearby Homes
- 20982 E 40th Place
- 4029 Orleans St
- 3851 Orleans St
- 20930 E 42nd Ave
- 21535 E 39th Ave
- 21430 E 42nd Ave
- 20604 E 38th Place
- 4022 Perth St
- 3983 Jericho St
- 4315 Orleans St
- 20344 E 41st Ave
- 4192 Ireland Ct
- 21982 E 38th Place
- 4074 Picadilly Ct
- 4073 N Quatar Ct
- 3934 N Quatar Ct
- 4169 N Quatar Ct
- 4403 Picadilly Ct
- 4032 N Quatar Ct
- 4435 Picadilly Ct
- 20981 E 40th Ave
- 20992 E 40th Place
- 20961 E 40th Ave
- 21001 E 40th Ave
- 20972 E 40th Place
- 20951 E 40th Ave
- 21002 E 40th Place
- 3991 Malaya St
- 21011 E 40th Ave
- 20941 E 40th Ave
- 20960 E 40th Ave
- 20952 E 40th Place
- 3981 Malaya St
- 3990 Malaya St
- 21012 E 40th Place
- 20940 E 40th Ave
- 21021 E 40th Ave
- 20983 E 40th Place
- 20921 E 40th Ave
- 20993 E 40th Place
Your Personal Tour Guide
Ask me questions while you tour the home.