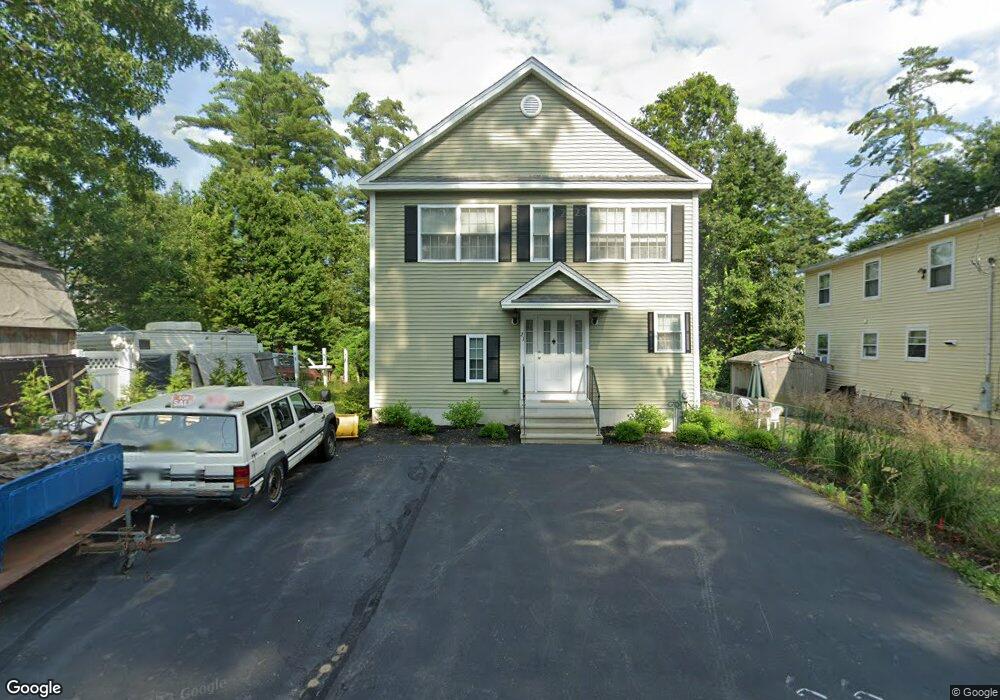
21 Coburn St Salem, NH 03079
Arlington Pond NeighborhoodEstimated Value: $514,000 - $576,000
2
Beds
1
Bath
1,072
Sq Ft
$505/Sq Ft
Est. Value
About This Home
This home is located at 21 Coburn St, Salem, NH 03079 and is currently estimated at $540,947, approximately $504 per square foot. 21 Coburn St is a home located in Rockingham County with nearby schools including North Salem Elementary School, Woodbury School, and Salem High School.
Ownership History
Date
Name
Owned For
Owner Type
Purchase Details
Closed on
Feb 28, 2014
Sold by
George and George Janice Wallace
Bought by
George and George Janice Wallace
Current Estimated Value
Home Financials for this Owner
Home Financials are based on the most recent Mortgage that was taken out on this home.
Original Mortgage
$80,000
Outstanding Balance
$60,752
Interest Rate
4.39%
Mortgage Type
New Conventional
Estimated Equity
$480,195
Purchase Details
Closed on
Jan 19, 2010
Sold by
Slosek Blaise G and Gmac Mortgage Llc
Bought by
Fhlmc
Purchase Details
Closed on
Oct 10, 2006
Sold by
Slosek Richard B and Slosek Barbara
Bought by
Slosek Blaise
Home Financials for this Owner
Home Financials are based on the most recent Mortgage that was taken out on this home.
Original Mortgage
$90,000
Interest Rate
6.54%
Mortgage Type
Purchase Money Mortgage
Purchase Details
Closed on
Feb 17, 1999
Sold by
Conceison James
Bought by
Slosek Richard B and Slosek Barbara A
Home Financials for this Owner
Home Financials are based on the most recent Mortgage that was taken out on this home.
Original Mortgage
$28,000
Interest Rate
6.75%
Create a Home Valuation Report for This Property
The Home Valuation Report is an in-depth analysis detailing your home's value as well as a comparison with similar homes in the area
Home Values in the Area
Average Home Value in this Area
Purchase History
| Date | Buyer | Sale Price | Title Company |
|---|---|---|---|
| George | -- | -- | |
| Fhlmc | $121,400 | -- | |
| Slosek Blaise | $190,000 | -- | |
| Slosek Richard B | $35,000 | -- |
Source: Public Records
Mortgage History
| Date | Status | Borrower | Loan Amount |
|---|---|---|---|
| Open | George | $80,000 | |
| Previous Owner | Slosek Richard B | $115,000 | |
| Previous Owner | Slosek Richard B | $90,000 | |
| Previous Owner | Slosek Richard B | $28,000 |
Source: Public Records
Tax History Compared to Growth
Tax History
| Year | Tax Paid | Tax Assessment Tax Assessment Total Assessment is a certain percentage of the fair market value that is determined by local assessors to be the total taxable value of land and additions on the property. | Land | Improvement |
|---|---|---|---|---|
| 2024 | $6,195 | $352,000 | $113,400 | $238,600 |
| 2023 | $5,970 | $352,000 | $113,400 | $238,600 |
| 2022 | $5,650 | $352,000 | $113,400 | $238,600 |
| 2021 | $5,625 | $352,000 | $113,400 | $238,600 |
| 2020 | $5,600 | $254,300 | $81,000 | $173,300 |
| 2019 | $5,590 | $254,300 | $81,000 | $173,300 |
| 2018 | $5,352 | $254,300 | $81,000 | $173,300 |
| 2017 | $5,195 | $254,300 | $81,000 | $173,300 |
| 2016 | $5,195 | $254,300 | $81,000 | $173,300 |
| 2015 | $5,025 | $234,900 | $84,900 | $150,000 |
| 2014 | $4,884 | $234,900 | $84,900 | $150,000 |
| 2013 | $4,806 | $234,900 | $84,900 | $150,000 |
Source: Public Records
Map
Nearby Homes