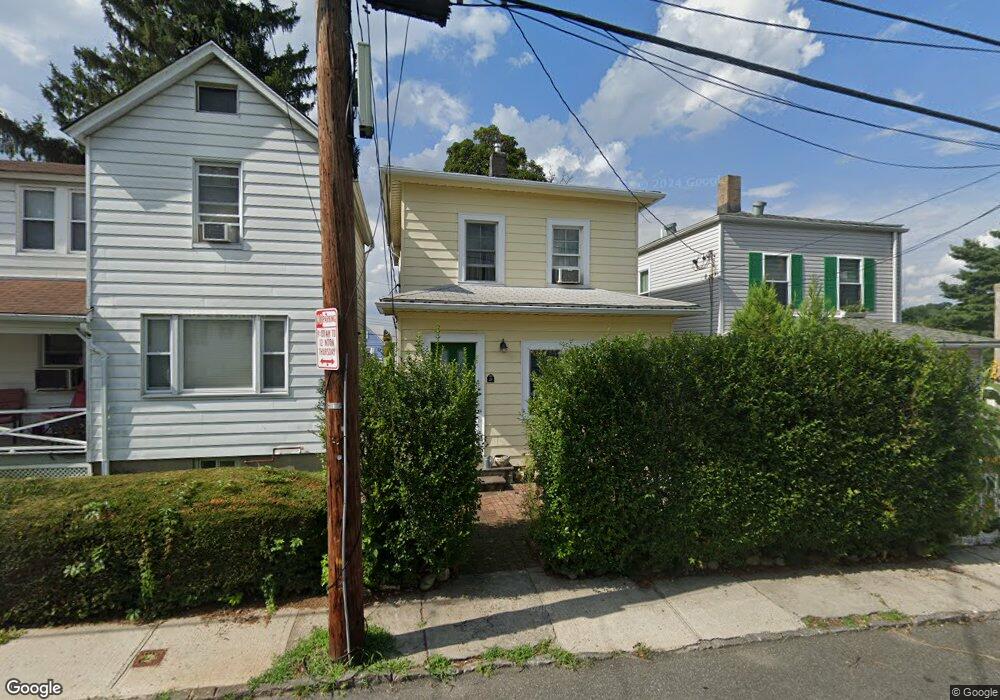
21 Devoe St Dobbs Ferry, NY 10522
Estimated Value: $639,000 - $813,000
3
Beds
2
Baths
1,197
Sq Ft
$609/Sq Ft
Est. Value
About This Home
This home is located at 21 Devoe St, Dobbs Ferry, NY 10522 and is currently estimated at $728,475, approximately $608 per square foot. 21 Devoe St is a home located in Westchester County with nearby schools including Springhurst Elementary School, Dobbs Ferry High School, and The Masters School.
Ownership History
Date
Name
Owned For
Owner Type
Purchase Details
Closed on
Jun 16, 2016
Sold by
Wright Terence V and Wright Sandra
Bought by
Mannino Sarah and Lacey William
Current Estimated Value
Home Financials for this Owner
Home Financials are based on the most recent Mortgage that was taken out on this home.
Original Mortgage
$388,000
Outstanding Balance
$309,207
Interest Rate
3.61%
Mortgage Type
New Conventional
Estimated Equity
$419,268
Purchase Details
Closed on
Mar 26, 2007
Sold by
Bonfiglio Michael
Bought by
Donnelly Gerard A
Purchase Details
Closed on
Apr 9, 2001
Sold by
Lucie Florence M
Bought by
Wright Terence and Wright Sandra
Home Financials for this Owner
Home Financials are based on the most recent Mortgage that was taken out on this home.
Original Mortgage
$168,000
Interest Rate
7.05%
Mortgage Type
Purchase Money Mortgage
Create a Home Valuation Report for This Property
The Home Valuation Report is an in-depth analysis detailing your home's value as well as a comparison with similar homes in the area
Home Values in the Area
Average Home Value in this Area
Purchase History
| Date | Buyer | Sale Price | Title Company |
|---|---|---|---|
| Mannino Sarah | $485,000 | Wfg National Title | |
| Donnelly Gerard A | $520,000 | Commonwealth Land Title Insu | |
| Wright Terence | $210,000 | Fidelity National Title Ins |
Source: Public Records
Mortgage History
| Date | Status | Borrower | Loan Amount |
|---|---|---|---|
| Open | Mannino Sarah | $388,000 | |
| Previous Owner | Wright Terence | $168,000 |
Source: Public Records
Tax History
| Year | Tax Paid | Tax Assessment Tax Assessment Total Assessment is a certain percentage of the fair market value that is determined by local assessors to be the total taxable value of land and additions on the property. | Land | Improvement |
|---|---|---|---|---|
| 2024 | $15,742 | $537,900 | $294,500 | $243,400 |
| 2023 | $14,913 | $494,100 | $280,500 | $213,600 |
| 2022 | $14,381 | $472,200 | $280,500 | $191,700 |
| 2021 | $17,002 | $437,300 | $280,500 | $156,800 |
| 2020 | $16,711 | $499,700 | $280,500 | $219,200 |
| 2019 | $16,113 | $499,700 | $280,500 | $219,200 |
| 2018 | $18,919 | $486,200 | $280,500 | $205,700 |
| 2017 | $1,686 | $468,200 | $280,500 | $187,700 |
| 2016 | $303,563 | $371,100 | $280,500 | $90,600 |
| 2015 | -- | $8,500 | $400 | $8,100 |
| 2014 | -- | $8,000 | $400 | $7,600 |
| 2013 | $6,555 | $8,000 | $400 | $7,600 |
Source: Public Records
Map
Nearby Homes
- 41 Devoe St
- 36 Belden Ave
- 13 English Ln Unit B
- 70 Washington Ave
- 10 Sherman Ave
- 13 Mcclelland Ave
- 164 Washington Ave
- 101 Beacon Hill Dr Unit 13
- 23 Bradley St
- 2 Belmont Dr
- 17 Manor House Dr Unit K 14
- 17 Manor House Dr Unit K13
- 0 Lyman Place Unit KEY923539
- 5 Forkland Ln
- 14 Manor House Dr Unit G29
- 16 Ogden Ave
- 156 Palisade St Unit A
- 156 Palisade St Unit C
- 5 Belmont Dr
- 0 Ashford Ave Unit KEY885130
Your Personal Tour Guide
Ask me questions while you tour the home.