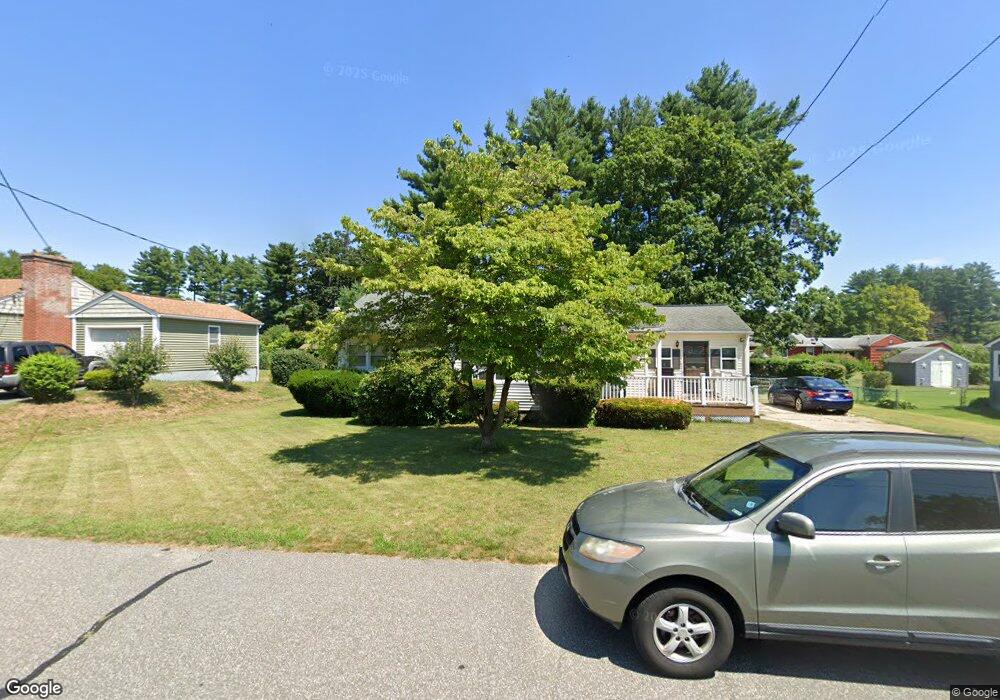
21 Drury St Springfield, MA 01129
Boston Road NeighborhoodEstimated Value: $298,000 - $383,000
3
Beds
2
Baths
1,645
Sq Ft
$209/Sq Ft
Est. Value
About This Home
This home is located at 21 Drury St, Springfield, MA 01129 and is currently estimated at $343,215, approximately $208 per square foot. 21 Drury St is a home located in Hampden County with nearby schools including Warner, M Marcus Kiley Middle, and Springfield Central High School.
Ownership History
Date
Name
Owned For
Owner Type
Purchase Details
Closed on
Apr 30, 2004
Sold by
Wilson Evelyn
Bought by
Henry Derrick C and Wilson Evelyn
Current Estimated Value
Purchase Details
Closed on
May 28, 1999
Sold by
Stein Nellie
Bought by
Wilson Evelyn
Home Financials for this Owner
Home Financials are based on the most recent Mortgage that was taken out on this home.
Original Mortgage
$78,959
Interest Rate
6.82%
Mortgage Type
Commercial
Create a Home Valuation Report for This Property
The Home Valuation Report is an in-depth analysis detailing your home's value as well as a comparison with similar homes in the area
Home Values in the Area
Average Home Value in this Area
Purchase History
We collect this data history from publicly available records. To have your information removed, we recommend requesting removal directly through your county’s website.
| Date | Buyer | Sale Price | Title Company |
|---|---|---|---|
| Henry Derrick C | -- | -- | |
| Henry Derrick C | -- | -- | |
| Wilson Evelyn | $79,000 | -- | |
| Wilson Evelyn | $79,000 | -- |
Source: Public Records
Mortgage History
We collect this data history from publicly available records. To have your information removed, we recommend requesting removal directly through your county’s website.
| Date | Status | Borrower | Loan Amount |
|---|---|---|---|
| Previous Owner | Wilson Evelyn | $78,959 | |
| Previous Owner | Wilson Evelyn | $5,000 |
Source: Public Records
Tax History
| Year | Tax Paid | Tax Assessment Tax Assessment Total Assessment is a certain percentage of the fair market value that is determined by local assessors to be the total taxable value of land and additions on the property. | Land | Improvement |
|---|---|---|---|---|
| 2025 | $5,610 | $357,800 | $58,200 | $299,600 |
| 2024 | -- | $353,400 | $58,200 | $295,200 |
| 2023 | $0 | $323,800 | $55,400 | $268,400 |
| 2022 | $5,233 | $251,000 | $55,400 | $195,600 |
| 2021 | $0 | $237,100 | $50,300 | $186,800 |
| 2020 | $5,233 | $212,300 | $50,300 | $162,000 |
| 2019 | $0 | $214,600 | $50,300 | $164,300 |
| 2018 | $0 | $203,200 | $50,300 | $152,900 |
| 2017 | $0 | $177,300 | $45,300 | $132,000 |
| 2016 | -- | $177,300 | $45,300 | $132,000 |
| 2015 | -- | $177,300 | $45,300 | $132,000 |
Source: Public Records
Map
Nearby Homes
- 376 Hermitage Dr
- 147 Parkerview St
- 16 Pioneer Way
- 40 Better Way
- 46-48 Kent Rd
- 140 Temby St
- 70 Shumway St Unit 29
- 11 Lamplighter Ln
- 224 Nassau Dr
- 21 Wrona St
- 373 Nassau Dr
- 240 Pasco Rd
- 39 Wallace St
- 22 Pheasant Dr
- 111 Methuen St
- 192 Gardens Dr
- 202 Spikenard Cir
- 24 Dumaine St
- - Glenwood St
- 145 Moxon St
Your Personal Tour Guide
Ask me questions while you tour the home.