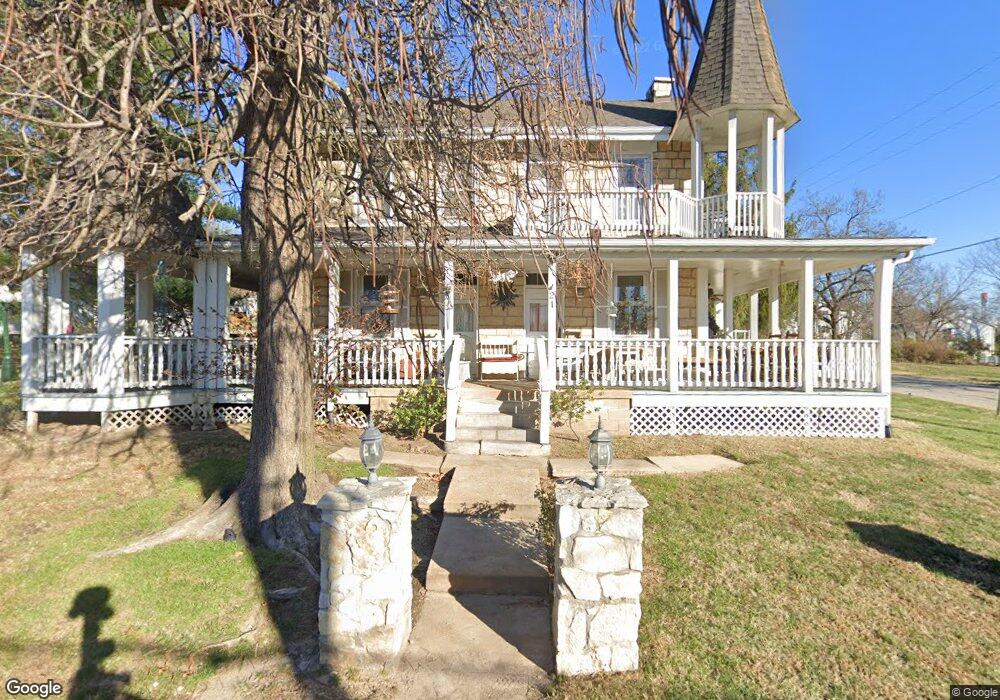
21 E 1st St Eureka, MO 63025
Estimated Value: $320,000 - $376,000
4
Beds
2
Baths
2,068
Sq Ft
$168/Sq Ft
Est. Value
About This Home
This home is located at 21 E 1st St, Eureka, MO 63025 and is currently estimated at $348,256, approximately $168 per square foot. 21 E 1st St is a home located in St. Louis County with nearby schools including Eureka Elementary School, Lasalle Springs Middle School, and Eureka Senior High School.
Ownership History
Date
Name
Owned For
Owner Type
Purchase Details
Closed on
Apr 17, 2003
Sold by
Thomas Tamara L
Bought by
Thomas Tamara L and Duckett Daniel L
Current Estimated Value
Home Financials for this Owner
Home Financials are based on the most recent Mortgage that was taken out on this home.
Original Mortgage
$153,600
Outstanding Balance
$62,926
Interest Rate
5.12%
Mortgage Type
Purchase Money Mortgage
Estimated Equity
$285,330
Purchase Details
Closed on
May 28, 1999
Sold by
Cherryhomes Glenn W and Bolin Kevin
Bought by
Thomas Tamara L
Home Financials for this Owner
Home Financials are based on the most recent Mortgage that was taken out on this home.
Original Mortgage
$156,000
Interest Rate
6.92%
Purchase Details
Closed on
Oct 30, 1997
Sold by
Greer Robert E and Ann Joan
Bought by
Cherryhomes Glenn W and Bolin Kevin
Create a Home Valuation Report for This Property
The Home Valuation Report is an in-depth analysis detailing your home's value as well as a comparison with similar homes in the area
Home Values in the Area
Average Home Value in this Area
Purchase History
| Date | Buyer | Sale Price | Title Company |
|---|---|---|---|
| Thomas Tamara L | -- | -- | |
| Thomas Tamara L | $195,000 | -- | |
| Cherryhomes Glenn W | -- | -- |
Source: Public Records
Mortgage History
| Date | Status | Borrower | Loan Amount |
|---|---|---|---|
| Open | Thomas Tamara L | $153,600 | |
| Closed | Thomas Tamara L | $156,000 | |
| Closed | Thomas Tamara L | $15,652 |
Source: Public Records
Tax History
| Year | Tax Paid | Tax Assessment Tax Assessment Total Assessment is a certain percentage of the fair market value that is determined by local assessors to be the total taxable value of land and additions on the property. | Land | Improvement |
|---|---|---|---|---|
| 2025 | $3,807 | $63,860 | $19,420 | $44,440 |
| 2024 | $3,807 | $50,990 | $14,570 | $36,420 |
| 2023 | $3,810 | $50,990 | $14,570 | $36,420 |
| 2022 | $2,966 | $36,930 | $14,570 | $22,360 |
| 2021 | $2,944 | $36,930 | $14,570 | $22,360 |
| 2020 | $3,122 | $37,450 | $14,460 | $22,990 |
| 2019 | $3,132 | $37,450 | $14,460 | $22,990 |
| 2018 | $2,777 | $31,330 | $10,600 | $20,730 |
| 2017 | $2,675 | $31,330 | $10,600 | $20,730 |
| 2016 | $2,473 | $27,850 | $7,710 | $20,140 |
Source: Public Records
Map
Nearby Homes
- 118 Towne Square Ct Unit D4
- 125 Towne Square Ct Unit 4E
- 637 N Virginia Ave
- 318 Kevin Jon Ct
- 329 Kevin Jon Ct
- 369 Cerny Ave
- 15 Rockwood Place Ct
- 75 Old Farmhouse Way
- 826 Lower Field Ln
- 830 Lower Field Ln
- 83 Old Farmhouse Way
- 808 Lower Field Ln
- 944 Emerald Oaks Ct
- 345 Palisades Ridge Ct
- 3 Leona Ln
- 814 Eureka Rd
- 160 Hunters Run Ct
- 412 Parkview Ln
- 1000 Eureka Rd
- 17114 Elm Trail Dr
- 15 E 1st St
- 101 E 1st St
- 16 E 2nd St
- 12 E 2nd St
- 116 Beverly St
- 8 E 2nd St
- 116 N Central Ave
- 120 N Central Ave
- 0TBB Ashton Woods 1 2 Story Homes
- 0TBB Aspen Lot 1&2 Lower Byrnesmill
- 0TBB 2 Sty@ashton Woods
- 100 Towne Square Ct Unit L
- 100 Towne Square Ct Unit C
- 100 Towne Square Ct Unit E
- 100 Towne Square Ct Unit B
- 100 Towne Square Ct Unit I
- 100 Towne Square Ct Unit G
- 100 Towne Square Ct Unit A
- 100 Towne Square Ct Unit H
- 100 Towne Square Ct Unit F
Your Personal Tour Guide
Ask me questions while you tour the home.