The Pinnacle 21 E Huron St Unit 1905 Chicago, IL 60611
River North NeighborhoodEstimated Value: $1,104,000 - $1,221,000
3
Beds
3
Baths
2,081
Sq Ft
$556/Sq Ft
Est. Value
About This Home
This home is located at 21 E Huron St Unit 1905, Chicago, IL 60611 and is currently estimated at $1,157,302, approximately $556 per square foot. 21 E Huron St Unit 1905 is a home located in Cook County with nearby schools including Ogden Elementary School, Wells Community Academy High School, and Muchin College Prep.
Ownership History
Date
Name
Owned For
Owner Type
Purchase Details
Closed on
Nov 14, 2024
Sold by
Palmisano Maria C and Bartholomew Frank
Bought by
Palmisano Living Trust and Palmisano
Current Estimated Value
Purchase Details
Closed on
Apr 10, 2009
Sold by
Gemuenden Steffen
Bought by
Palmisano Maria C
Purchase Details
Closed on
May 11, 2007
Sold by
Smith Cynthia L
Bought by
Gemuenden Steffen
Purchase Details
Closed on
Jun 23, 2005
Sold by
Smith Cynthia and Ritchie Thomas W
Bought by
Smith Cynthia
Purchase Details
Closed on
Dec 10, 2004
Sold by
Fordham 21 E Huron Llc
Bought by
Ritchie Thomas W and Smith Cynthia L
Home Financials for this Owner
Home Financials are based on the most recent Mortgage that was taken out on this home.
Original Mortgage
$650,000
Interest Rate
4.87%
Mortgage Type
Unknown
Create a Home Valuation Report for This Property
The Home Valuation Report is an in-depth analysis detailing your home's value as well as a comparison with similar homes in the area
Home Values in the Area
Average Home Value in this Area
Purchase History
| Date | Buyer | Sale Price | Title Company |
|---|---|---|---|
| Palmisano Living Trust | -- | None Listed On Document | |
| Palmisano Maria C | $1,150,000 | Multiple | |
| Gemuenden Steffen | $1,100,000 | Chicago Title Insurance Co | |
| Smith Cynthia | -- | -- | |
| Ritchie Thomas W | $933,000 | Near North Natl Title Corp |
Source: Public Records
Mortgage History
| Date | Status | Borrower | Loan Amount |
|---|---|---|---|
| Previous Owner | Ritchie Thomas W | $650,000 | |
| Closed | Ritchie Thomas W | $35,000 |
Source: Public Records
Tax History Compared to Growth
Tax History
| Year | Tax Paid | Tax Assessment Tax Assessment Total Assessment is a certain percentage of the fair market value that is determined by local assessors to be the total taxable value of land and additions on the property. | Land | Improvement |
|---|---|---|---|---|
| 2024 | $21,312 | $93,533 | $2,656 | $90,877 |
| 2023 | $21,973 | $101,011 | $2,180 | $98,831 |
| 2022 | $21,973 | $106,830 | $2,180 | $104,650 |
| 2021 | $21,901 | $108,913 | $2,180 | $106,733 |
| 2020 | $24,004 | $107,752 | $1,652 | $106,100 |
| 2019 | $22,790 | $113,431 | $1,652 | $111,779 |
| 2018 | $22,640 | $114,611 | $1,652 | $112,959 |
| 2017 | $22,857 | $106,176 | $1,407 | $104,769 |
| 2016 | $21,266 | $106,176 | $1,407 | $104,769 |
| 2015 | $19,456 | $106,176 | $1,407 | $104,769 |
| 2014 | $16,489 | $88,870 | $1,101 | $87,769 |
| 2013 | $16,163 | $88,870 | $1,101 | $87,769 |
Source: Public Records
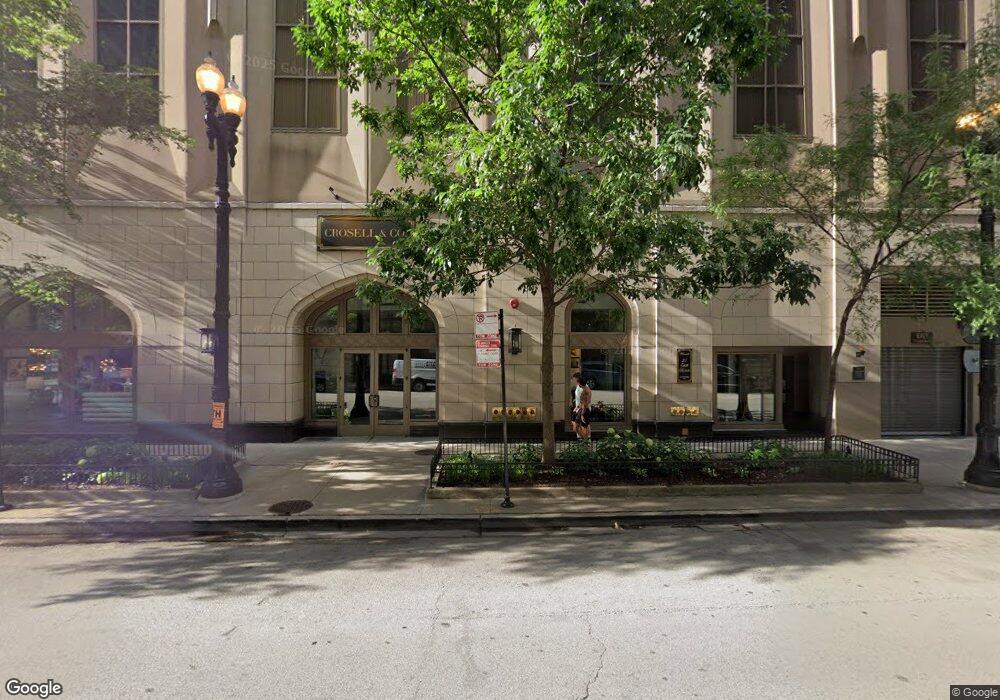
About The Pinnacle
Map
Nearby Homes
- 21 E Huron St Unit 3704
- 21 E Huron St Unit 1806
- 21 E Huron St Unit 1101
- 21 E Huron St Unit 4301
- 21 E Huron St Unit 2606
- 21 E Huron St Unit 1407
- 21 E Huron St Unit 4701
- 21 E Huron St Unit 3301
- 21 E Huron St Unit 706
- 2 E Erie St Unit 3605
- 2 E Erie St Unit 3403
- 2 E Erie St Unit G549
- 2 E Erie St Unit G208A
- 25 E Superior St Unit 904
- 25 E Superior St Unit 902
- 25 E Superior St Unit 605
- 25 E Superior St Unit 2405
- 25 E Superior St Unit 2302
- 25 E Superior St Unit 3004
- 25 E Superior St Unit 4302
- 21 E Huron St Unit P617
- 21 E Huron St Unit 801
- 21 E Huron St Unit 3805
- 21 E Huron St Unit 3903
- 21 E Huron St Unit 3901
- 21 E Huron St Unit 3803
- 21 E Huron St Unit 3204
- 21 E Huron St Unit 3004
- 21 E Huron St Unit 2904
- 21 E Huron St Unit 2504
- 21 E Huron St Unit 2206
- 21 E Huron St Unit 2105
- 21 E Huron St Unit 1701
- 21 E Huron St Unit 1602
- 21 E Huron St Unit 1402
- 21 E Huron St Unit 1202
- 21 E Huron St Unit 1107
- 21 E Huron St Unit 905
- 21 E Huron St Unit 901
- 21 E Huron St Unit 701