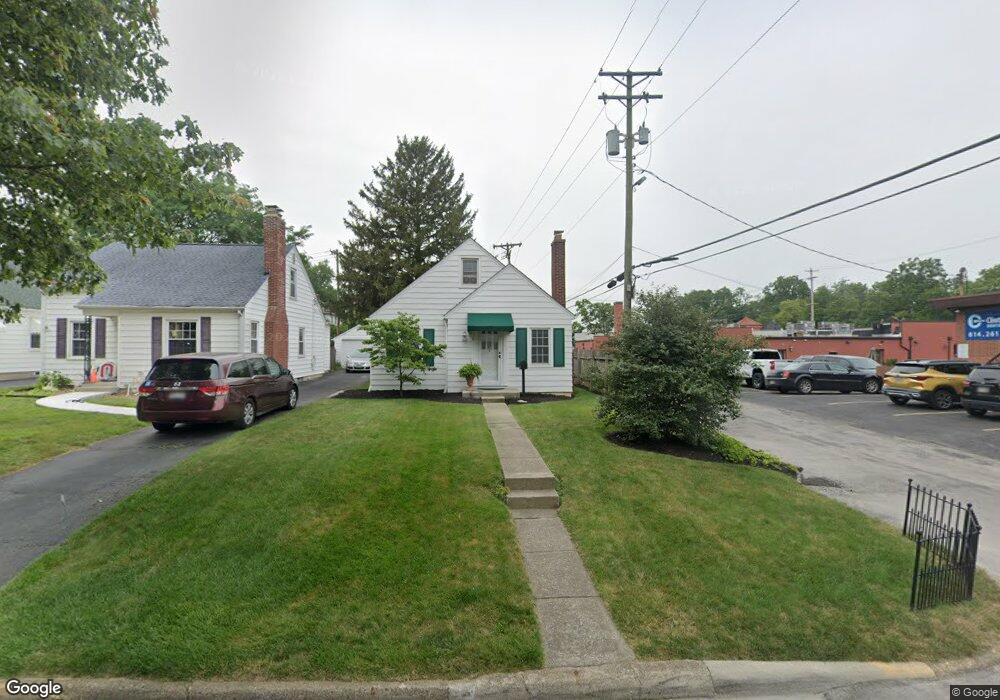
21 E Royal Forest Blvd Columbus, OH 43214
Clintonville NeighborhoodEstimated Value: $301,000 - $350,000
3
Beds
1
Bath
1,086
Sq Ft
$298/Sq Ft
Est. Value
About This Home
This home is located at 21 E Royal Forest Blvd, Columbus, OH 43214 and is currently estimated at $323,679, approximately $298 per square foot. 21 E Royal Forest Blvd is a home located in Franklin County with nearby schools including Indian Springs Elementary School, Dominion Middle School, and Whetstone High School.
Ownership History
Date
Name
Owned For
Owner Type
Purchase Details
Closed on
Jul 25, 2024
Sold by
21 Erfb Llc
Bought by
Smith Leslie A
Current Estimated Value
Purchase Details
Closed on
Jul 18, 2024
Sold by
21 Erfb Llc
Bought by
Smith Leslie A
Purchase Details
Closed on
Oct 16, 2023
Sold by
Smith Leslie A
Bought by
21 Erfb Llc
Purchase Details
Closed on
May 31, 2001
Sold by
Sposito Patricia A
Bought by
Yavorsky Leslie Anne
Home Financials for this Owner
Home Financials are based on the most recent Mortgage that was taken out on this home.
Original Mortgage
$114,300
Interest Rate
7.18%
Purchase Details
Closed on
Jun 12, 1991
Bought by
Sposito Patricia A
Purchase Details
Closed on
Aug 14, 1987
Create a Home Valuation Report for This Property
The Home Valuation Report is an in-depth analysis detailing your home's value as well as a comparison with similar homes in the area
Home Values in the Area
Average Home Value in this Area
Purchase History
| Date | Buyer | Sale Price | Title Company |
|---|---|---|---|
| Smith Leslie A | -- | None Listed On Document | |
| Smith Leslie A | -- | None Listed On Document | |
| 21 Erfb Llc | -- | None Listed On Document | |
| Yavorsky Leslie Anne | $127,000 | Connor Title Co | |
| Sposito Patricia A | $74,000 | -- | |
| -- | $62,000 | -- |
Source: Public Records
Mortgage History
| Date | Status | Borrower | Loan Amount |
|---|---|---|---|
| Previous Owner | Yavorsky Leslie Anne | $114,300 |
Source: Public Records
Tax History Compared to Growth
Tax History
| Year | Tax Paid | Tax Assessment Tax Assessment Total Assessment is a certain percentage of the fair market value that is determined by local assessors to be the total taxable value of land and additions on the property. | Land | Improvement |
|---|---|---|---|---|
| 2024 | $3,795 | $84,570 | $36,160 | $48,410 |
| 2023 | $3,747 | $84,570 | $36,160 | $48,410 |
| 2022 | $3,607 | $69,550 | $21,910 | $47,640 |
| 2021 | $3,614 | $69,550 | $21,910 | $47,640 |
| 2020 | $3,618 | $69,550 | $21,910 | $47,640 |
| 2019 | $3,330 | $54,890 | $16,840 | $38,050 |
| 2018 | $3,027 | $54,890 | $16,840 | $38,050 |
| 2017 | $3,211 | $54,890 | $16,840 | $38,050 |
| 2016 | $3,009 | $45,430 | $14,070 | $31,360 |
| 2015 | $2,732 | $45,430 | $14,070 | $31,360 |
| 2014 | $2,739 | $45,430 | $14,070 | $31,360 |
| 2013 | $1,286 | $43,260 | $13,405 | $29,855 |
Source: Public Records
Map
Nearby Homes
- 4 W Royal Forest Blvd
- 134 E Jeffrey Place
- 93 Leland Ave
- 116 Rathbone Ave
- 247 E Jeffrey Place
- 202 Rathbone Ave
- 156 E Weisheimer Rd
- 255 Garden Rd
- 343 E Jeffrey Place
- 381 E Jeffrey Place
- 26 E Schreyer Place
- 420 E Beechwold Blvd
- 224 Morse Rd
- 278 E Dominion Blvd
- 142 W Schreyer Place
- 4464 Zeller Rd
- 411 Garden Rd
- 122 W Henderson Rd
- 243 E Schreyer Place
- 111 W Henderson Rd
- 25 E Royal Forest Blvd
- 4808 N High St
- 37 E Royal Forest Blvd
- 32 E Beechwold Blvd
- 4784 N High St
- 22 E Royal Forest Blvd
- 26 E Royal Forest Blvd
- 32 E Royal Forest Blvd
- 41 E Royal Forest Blvd
- 42 E Beechwold Blvd
- 38 E Royal Forest Blvd
- 53 E Royal Forest Blvd
- 44 E Royal Forest Blvd
- 48 E Beechwold Blvd
- 48 E Royal Forest Blvd
- 4766-4768 N High St
- 60 E Beechwold Blvd
- 54 E Royal Forest Blvd
- 63 E Royal Forest Blvd
- 21 E Beechwold Blvd