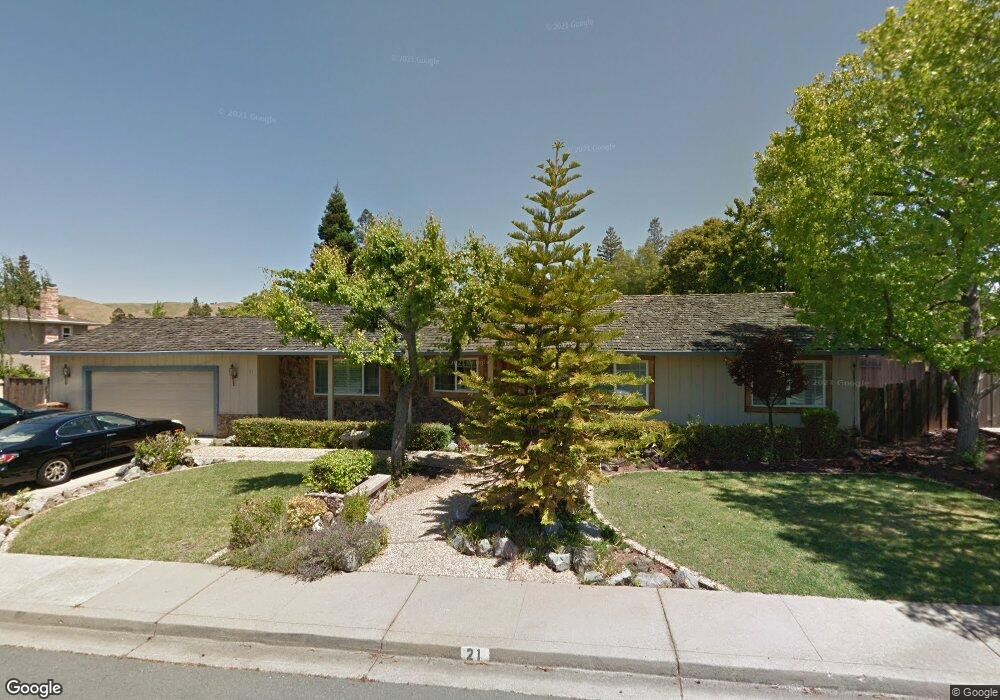
21 Fleming Ct Clayton, CA 94517
Estimated Value: $1,068,000 - $1,187,000
3
Beds
2
Baths
2,128
Sq Ft
$527/Sq Ft
Est. Value
About This Home
This home is located at 21 Fleming Ct, Clayton, CA 94517 and is currently estimated at $1,121,940, approximately $527 per square foot. 21 Fleming Ct is a home located in Contra Costa County with nearby schools including Mt. Diablo Elementary School, Diablo View Middle School, and College Park High School.
Ownership History
Date
Name
Owned For
Owner Type
Purchase Details
Closed on
Jul 6, 1999
Sold by
Sellers Edward A
Bought by
Romero Samuel and Romero Victoria A
Current Estimated Value
Home Financials for this Owner
Home Financials are based on the most recent Mortgage that was taken out on this home.
Original Mortgage
$276,000
Outstanding Balance
$74,626
Interest Rate
7.12%
Mortgage Type
Purchase Money Mortgage
Estimated Equity
$1,047,314
Purchase Details
Closed on
Mar 13, 1998
Sold by
Sellers Edward A
Bought by
Sellers Edward A
Home Financials for this Owner
Home Financials are based on the most recent Mortgage that was taken out on this home.
Original Mortgage
$243,000
Interest Rate
7%
Mortgage Type
Purchase Money Mortgage
Purchase Details
Closed on
Dec 20, 1996
Sold by
Sellers Kristine L
Bought by
Sellers Edward A
Home Financials for this Owner
Home Financials are based on the most recent Mortgage that was taken out on this home.
Original Mortgage
$37,500
Interest Rate
7.67%
Mortgage Type
Seller Take Back
Create a Home Valuation Report for This Property
The Home Valuation Report is an in-depth analysis detailing your home's value as well as a comparison with similar homes in the area
Home Values in the Area
Average Home Value in this Area
Purchase History
| Date | Buyer | Sale Price | Title Company |
|---|---|---|---|
| Romero Samuel | $345,000 | Placer Title Company | |
| Sellers Edward A | -- | Commonwealth Land Title Co | |
| Sellers Edward A | -- | -- |
Source: Public Records
Mortgage History
| Date | Status | Borrower | Loan Amount |
|---|---|---|---|
| Open | Romero Samuel | $276,000 | |
| Previous Owner | Sellers Edward A | $243,000 | |
| Previous Owner | Sellers Edward A | $37,500 | |
| Closed | Romero Samuel | $51,700 |
Source: Public Records
Tax History
| Year | Tax Paid | Tax Assessment Tax Assessment Total Assessment is a certain percentage of the fair market value that is determined by local assessors to be the total taxable value of land and additions on the property. | Land | Improvement |
|---|---|---|---|---|
| 2025 | $7,126 | $530,237 | $219,776 | $310,461 |
| 2024 | $6,804 | $519,841 | $215,467 | $304,374 |
| 2023 | $6,804 | $509,649 | $211,243 | $298,406 |
| 2022 | $6,702 | $499,656 | $207,101 | $292,555 |
| 2021 | $6,532 | $489,860 | $203,041 | $286,819 |
| 2019 | $6,396 | $475,333 | $197,020 | $278,313 |
| 2018 | $6,153 | $466,013 | $193,157 | $272,856 |
| 2017 | $5,946 | $456,876 | $189,370 | $267,506 |
| 2016 | $5,777 | $447,918 | $185,657 | $262,261 |
| 2015 | $5,703 | $441,191 | $182,869 | $258,322 |
| 2014 | $5,598 | $432,549 | $179,287 | $253,262 |
Source: Public Records
Map
Nearby Homes
- 218 Mountaire Cir
- 314 Semillon Cir
- 367 Mt Washington Way
- 249 Stranahan Cir
- 5849 Mitchell Canyon Ct
- 186 Mt Wilson Way
- 5817 Mitchell Canyon Ct
- 1048 Panadero Ct
- 5795 Lewis Way
- 1000 Froyd Rd
- 510 Mt Davidson Ct
- 5 Pardi Ln
- 1267 Quiet Cir
- 33 El Molino Dr
- 23 Capistrano Ct
- 402 Chupcan Place
- 1421 Lydia Ln
- 5565 Jasper Ct
- 5565 Banff Ct
- 5535 Merritt Dr
- 323 Roundhill Place
- 11 Fleming Ct
- 31 Fleming Ct
- 325 Roundhill Ct
- 321 Roundhill Place
- 20 Fleming Ct
- 10 Fleming Ct
- 30 Fleming Ct
- 41 Fleming Ct
- 327 Roundhill Ct
- 40 Fleming Ct
- 163 Mt Vernon Dr
- 330 Roundhill Ct
- 208 Fleming Dr
- 212 Fleming Dr
- 159 Mt Vernon Dr
- 167 Mt Vernon Dr
- 322 Roundhill Place
- 204 Fleming Dr
- 329 Roundhill Ct
Your Personal Tour Guide
Ask me questions while you tour the home.