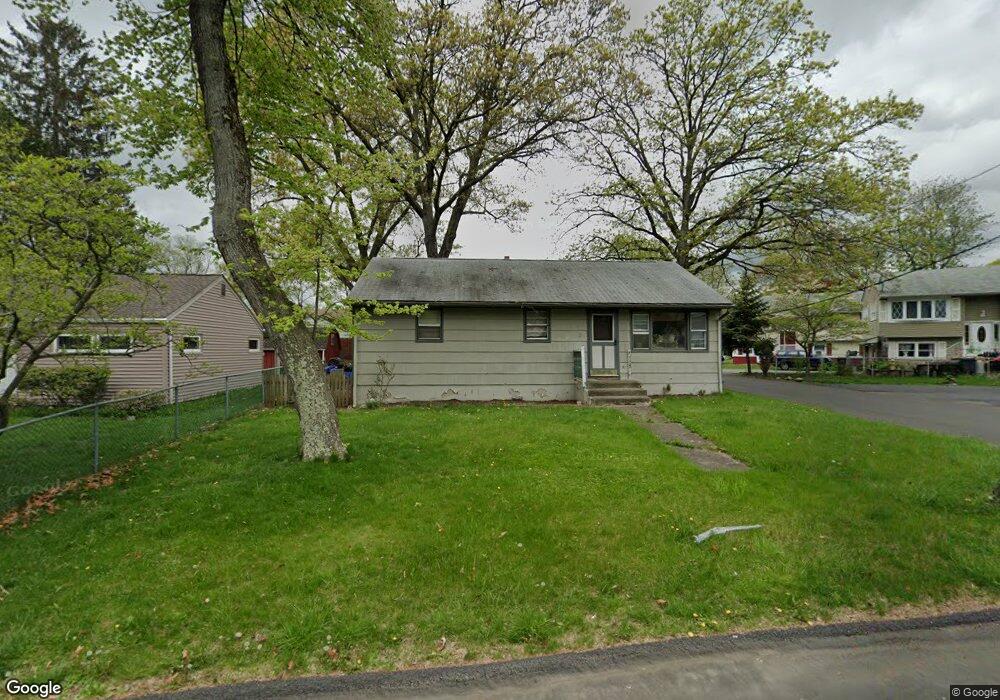
21 Grove St Garnerville, NY 10923
Estimated Value: $451,000 - $480,640
3
Beds
2
Baths
988
Sq Ft
$470/Sq Ft
Est. Value
About This Home
This home is located at 21 Grove St, Garnerville, NY 10923 and is currently estimated at $464,660, approximately $470 per square foot. 21 Grove St is a home located in Rockland County with nearby schools including West Haverstraw Elementary School, Haverstraw Elementary School, and Fieldstone Secondary School.
Ownership History
Date
Name
Owned For
Owner Type
Purchase Details
Closed on
May 30, 2008
Sold by
Sorensen Michael J and Sorensen Michelle
Bought by
Rifflard Keith and Rifflard Carol
Current Estimated Value
Home Financials for this Owner
Home Financials are based on the most recent Mortgage that was taken out on this home.
Original Mortgage
$274,811
Outstanding Balance
$177,065
Interest Rate
6.13%
Mortgage Type
FHA
Estimated Equity
$287,595
Purchase Details
Closed on
Dec 30, 2005
Sold by
Sorensen Michael J
Bought by
Sorensen Michael J and Sorensen Michelle
Home Financials for this Owner
Home Financials are based on the most recent Mortgage that was taken out on this home.
Original Mortgage
$55,000
Interest Rate
5.82%
Mortgage Type
Stand Alone Second
Create a Home Valuation Report for This Property
The Home Valuation Report is an in-depth analysis detailing your home's value as well as a comparison with similar homes in the area
Home Values in the Area
Average Home Value in this Area
Purchase History
| Date | Buyer | Sale Price | Title Company |
|---|---|---|---|
| Rifflard Keith | $285,000 | Fidelity National Title Insu | |
| Sorensen Michael J | -- | Blackacre Title Agency Corp |
Source: Public Records
Mortgage History
| Date | Status | Borrower | Loan Amount |
|---|---|---|---|
| Open | Rifflard Keith | $274,811 | |
| Previous Owner | Sorensen Michael J | $55,000 |
Source: Public Records
Tax History
| Year | Tax Paid | Tax Assessment Tax Assessment Total Assessment is a certain percentage of the fair market value that is determined by local assessors to be the total taxable value of land and additions on the property. | Land | Improvement |
|---|---|---|---|---|
| 2024 | $13,593 | $192,000 | $75,100 | $116,900 |
| 2023 | $13,593 | $192,000 | $75,100 | $116,900 |
| 2022 | $1,976 | $192,000 | $75,100 | $116,900 |
| 2021 | $13,424 | $192,000 | $75,100 | $116,900 |
| 2020 | $10,593 | $192,000 | $75,100 | $116,900 |
| 2019 | $2,009 | $192,000 | $75,100 | $116,900 |
| 2018 | $10,332 | $192,000 | $75,100 | $116,900 |
| 2017 | $9,754 | $192,000 | $75,100 | $116,900 |
| 2016 | $9,733 | $192,000 | $75,100 | $116,900 |
| 2015 | -- | $192,000 | $75,100 | $116,900 |
| 2014 | -- | $192,000 | $75,100 | $116,900 |
Source: Public Records
Map
Nearby Homes
Your Personal Tour Guide
Ask me questions while you tour the home.