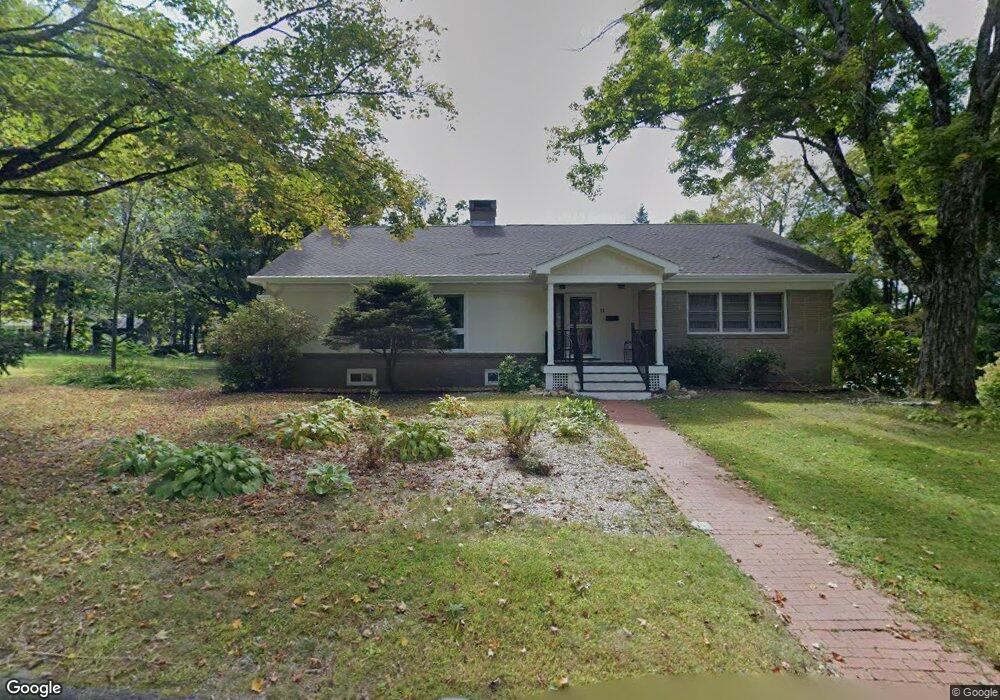
21 Kimball St Florence, MA 01062
Florence NeighborhoodEstimated Value: $561,000 - $669,000
3
Beds
3
Baths
1,728
Sq Ft
$365/Sq Ft
Est. Value
About This Home
This home is located at 21 Kimball St, Florence, MA 01062 and is currently estimated at $629,997, approximately $364 per square foot. 21 Kimball St is a home located in Hampshire County with nearby schools including Northampton High School, The Montessori School of Northampton, and Lander Grinspoon Academy.
Ownership History
Date
Name
Owned For
Owner Type
Purchase Details
Closed on
Jan 14, 2011
Sold by
Mcgrath Nancy T and Tobin-Tacy Margaret
Bought by
Bell Ross J and Bell Erica H
Current Estimated Value
Home Financials for this Owner
Home Financials are based on the most recent Mortgage that was taken out on this home.
Original Mortgage
$225,000
Outstanding Balance
$149,305
Interest Rate
4.46%
Mortgage Type
Purchase Money Mortgage
Estimated Equity
$480,692
Purchase Details
Closed on
Dec 10, 2010
Sold by
Tobin Mcgrath Nancy T and Tobin Tacy Margaret
Bought by
Shea T E
Home Financials for this Owner
Home Financials are based on the most recent Mortgage that was taken out on this home.
Original Mortgage
$225,000
Outstanding Balance
$149,305
Interest Rate
4.46%
Mortgage Type
Purchase Money Mortgage
Estimated Equity
$480,692
Purchase Details
Closed on
Jan 22, 2010
Sold by
Margaret W Tobin Ret
Bought by
Tobin Mcgrath Nancy T and Tobin Tacy Margaret
Create a Home Valuation Report for This Property
The Home Valuation Report is an in-depth analysis detailing your home's value as well as a comparison with similar homes in the area
Home Values in the Area
Average Home Value in this Area
Purchase History
| Date | Buyer | Sale Price | Title Company |
|---|---|---|---|
| Bell Ross J | $352,500 | -- | |
| Shea T E | $115,000 | -- | |
| Tobin Mcgrath Nancy T | -- | -- |
Source: Public Records
Mortgage History
| Date | Status | Borrower | Loan Amount |
|---|---|---|---|
| Open | Bell Ross J | $225,000 |
Source: Public Records
Tax History
| Year | Tax Paid | Tax Assessment Tax Assessment Total Assessment is a certain percentage of the fair market value that is determined by local assessors to be the total taxable value of land and additions on the property. | Land | Improvement |
|---|---|---|---|---|
| 2025 | $8,915 | $640,000 | $171,900 | $468,100 |
| 2024 | $8,355 | $550,000 | $150,200 | $399,800 |
| 2023 | $7,795 | $492,100 | $136,500 | $355,600 |
| 2022 | $6,582 | $367,900 | $127,700 | $240,200 |
| 2021 | $6,321 | $363,900 | $121,700 | $242,200 |
| 2020 | $6,114 | $363,900 | $121,700 | $242,200 |
| 2019 | $6,156 | $354,400 | $121,700 | $232,700 |
| 2018 | $6,090 | $357,400 | $121,700 | $235,700 |
| 2017 | $5,683 | $340,500 | $121,700 | $218,800 |
| 2016 | $5,502 | $340,500 | $121,700 | $218,800 |
| 2015 | $5,340 | $338,000 | $131,700 | $206,300 |
| 2014 | $5,125 | $333,000 | $131,700 | $201,300 |
Source: Public Records
Map
Nearby Homes
- 44 Sheffield Ln
- 2 Juniper Place
- 76 Maple St
- 67 Park St Unit A
- 575 Bridge Rd Unit 12-7
- 575 Bridge Rd Unit 10-5
- 37 Landy Ave
- 0 Terrace Ln
- 88 Pines Edge Dr Unit 88
- 289 Hatfield St
- 42 Clark St
- 53 E Center St
- 63 Riverside Dr
- 0 Haydenville Rd
- 32 Stonewall Dr
- 48 Evergreen Rd Unit 306
- 44 Evergreen Rd Unit 302
- 139 Water St
- 61 Woodlawn Ave
- 296 Ryan Rd Unit A
Your Personal Tour Guide
Ask me questions while you tour the home.