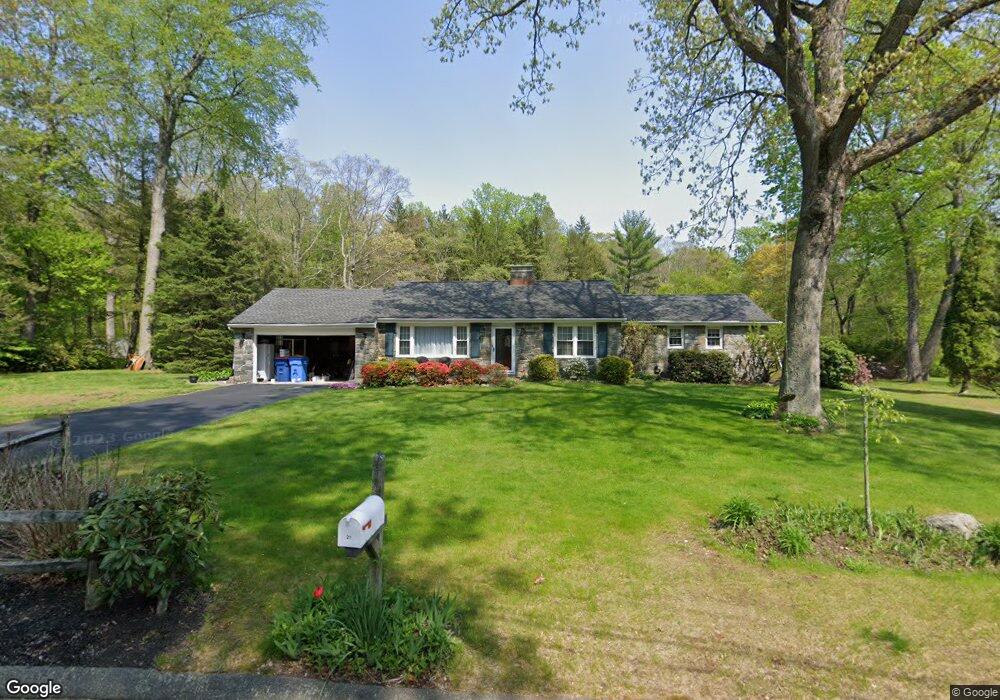
21 Lois Cir Monroe, CT 06468
Estimated Value: $572,000 - $693,000
4
Beds
3
Baths
1,852
Sq Ft
$333/Sq Ft
Est. Value
About This Home
This home is located at 21 Lois Cir, Monroe, CT 06468 and is currently estimated at $615,800, approximately $332 per square foot. 21 Lois Cir is a home located in Fairfield County with nearby schools including Monroe Elementary School, Jockey Hollow Middle School, and Masuk High School.
Ownership History
Date
Name
Owned For
Owner Type
Purchase Details
Closed on
Apr 22, 1994
Sold by
Anton Kevin and Anton Irene
Bought by
Fontneau Brian and Fontneau Karen
Current Estimated Value
Home Financials for this Owner
Home Financials are based on the most recent Mortgage that was taken out on this home.
Original Mortgage
$168,000
Interest Rate
7.6%
Mortgage Type
Unknown
Create a Home Valuation Report for This Property
The Home Valuation Report is an in-depth analysis detailing your home's value as well as a comparison with similar homes in the area
Home Values in the Area
Average Home Value in this Area
Purchase History
| Date | Buyer | Sale Price | Title Company |
|---|---|---|---|
| Fontneau Brian | $210,000 | -- | |
| Fontneau Brian | $210,000 | -- |
Source: Public Records
Mortgage History
| Date | Status | Borrower | Loan Amount |
|---|---|---|---|
| Closed | Fontneau Brian | $175,000 | |
| Closed | Fontneau Brian | $168,000 | |
| Previous Owner | Fontneau Brian | $135,000 |
Source: Public Records
Tax History
| Year | Tax Paid | Tax Assessment Tax Assessment Total Assessment is a certain percentage of the fair market value that is determined by local assessors to be the total taxable value of land and additions on the property. | Land | Improvement |
|---|---|---|---|---|
| 2025 | $10,565 | $368,520 | $110,320 | $258,200 |
| 2024 | $9,081 | $237,300 | $96,300 | $141,000 |
| 2023 | $8,911 | $237,300 | $96,300 | $141,000 |
| 2022 | $8,747 | $237,300 | $96,300 | $141,000 |
| 2021 | $8,628 | $237,300 | $96,300 | $141,000 |
| 2020 | $8,419 | $237,300 | $96,300 | $141,000 |
| 2019 | $18,552 | $223,900 | $96,300 | $127,600 |
| 2018 | $20,355 | $223,900 | $96,300 | $127,600 |
| 2017 | $8,007 | $223,900 | $96,300 | $127,600 |
| 2016 | $7,837 | $223,900 | $96,300 | $127,600 |
| 2015 | $7,691 | $223,900 | $96,300 | $127,600 |
| 2014 | $7,554 | $243,600 | $120,820 | $122,780 |
Source: Public Records
Map
Nearby Homes
- 13 Surrey Ln
- 115 Wheeler Rd
- 249 Wheeler Rd
- 67 Hidden Knolls Cir
- 286 Moose Hill Rd
- 124 Old Tannery Rd
- 261 Moose Hill Rd
- 40 Walnut St
- 68 Longview Rd
- 66 Heather Rd
- 80 Woodlawn Rd
- 56 Lazy Brook Rd
- 36 Spinning Wheel Rd
- 1536 & 1564 Monroe Turnpike
- 6 Dartmouth Dr
- 23 Bonita Dr
- 671 Elm St
- 59 Flint Ridge Rd
- 7 Canterbury Ln
- 15 North St
Your Personal Tour Guide
Ask me questions while you tour the home.