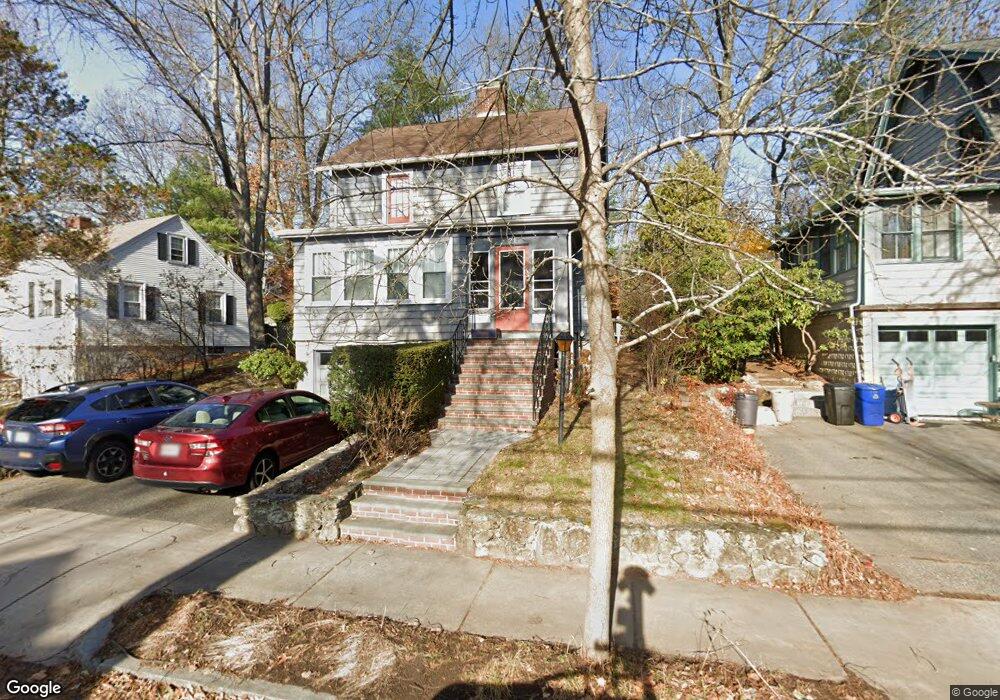
21 Longfellow Rd Arlington, MA 02476
Arlington Center NeighborhoodEstimated Value: $1,135,000 - $1,262,000
3
Beds
2
Baths
1,400
Sq Ft
$849/Sq Ft
Est. Value
About This Home
This home is located at 21 Longfellow Rd, Arlington, MA 02476 and is currently estimated at $1,189,181, approximately $849 per square foot. 21 Longfellow Rd is a home located in Middlesex County with nearby schools including Brackett Elementary School, Ottoson Middle School, and Arlington High School.
Ownership History
Date
Name
Owned For
Owner Type
Purchase Details
Closed on
Apr 15, 2011
Sold by
Losey Heather C and Ehmann David E
Bought by
Billmers Matthew P and Alterman Sharon R
Current Estimated Value
Purchase Details
Closed on
Jul 26, 2004
Sold by
Goggin Edward J and Foster Judith L
Bought by
Ehmann David E and Losey Heather C
Home Financials for this Owner
Home Financials are based on the most recent Mortgage that was taken out on this home.
Original Mortgage
$422,320
Interest Rate
6.28%
Mortgage Type
Purchase Money Mortgage
Purchase Details
Closed on
Dec 11, 1992
Sold by
Burns Joseph R and Letterie Barbara J
Bought by
Goggin Edward J and Foster Judith L
Home Financials for this Owner
Home Financials are based on the most recent Mortgage that was taken out on this home.
Original Mortgage
$163,000
Interest Rate
8.16%
Mortgage Type
Purchase Money Mortgage
Create a Home Valuation Report for This Property
The Home Valuation Report is an in-depth analysis detailing your home's value as well as a comparison with similar homes in the area
Home Values in the Area
Average Home Value in this Area
Purchase History
| Date | Buyer | Sale Price | Title Company |
|---|---|---|---|
| Billmers Matthew P | $515,000 | -- | |
| Ehmann David E | $527,900 | -- | |
| Goggin Edward J | $223,000 | -- |
Source: Public Records
Mortgage History
| Date | Status | Borrower | Loan Amount |
|---|---|---|---|
| Previous Owner | Ehmann David E | $422,320 | |
| Previous Owner | Goggin Edward J | $163,000 | |
| Previous Owner | Goggin Edward J | $112,000 |
Source: Public Records
Tax History Compared to Growth
Tax History
| Year | Tax Paid | Tax Assessment Tax Assessment Total Assessment is a certain percentage of the fair market value that is determined by local assessors to be the total taxable value of land and additions on the property. | Land | Improvement |
|---|---|---|---|---|
| 2025 | $11,044 | $1,025,400 | $580,400 | $445,000 |
| 2024 | $10,239 | $966,900 | $557,200 | $409,700 |
| 2023 | $9,670 | $862,600 | $487,600 | $375,000 |
| 2022 | $9,203 | $805,900 | $464,400 | $341,500 |
| 2021 | $9,028 | $796,100 | $464,400 | $331,700 |
| 2020 | $8,806 | $796,200 | $464,400 | $331,800 |
| 2019 | $7,785 | $691,400 | $435,300 | $256,100 |
| 2018 | $7,483 | $616,900 | $359,900 | $257,000 |
| 2017 | $7,384 | $587,900 | $330,900 | $257,000 |
| 2016 | $7,153 | $558,800 | $301,800 | $257,000 |
| 2015 | $7,412 | $547,000 | $296,000 | $251,000 |
Source: Public Records
Map
Nearby Homes
- 39 Newport St
- 53 Highland Ave
- 789 Concord Turnpike
- 10 Plymouth St Unit 10
- 36 Churchill Ave Unit 1
- 37 Fountain Rd Unit 2
- 37 Fountain Rd
- 995 Massachusetts Ave Unit 404
- 975 Massachusetts Ave Unit 307
- 975 Mass Ave Unit 106
- 1025 Massachusetts Ave Unit 204
- 204 Plan at Majestic Mill Brook
- 1025 Massachusetts Ave Unit 404
- 1025 Massachusetts Ave Unit 506
- 1025 Massachusetts Ave Unit 401
- 1025 Massachusetts Ave Unit 210
- 1025 Massachusetts Ave Unit 402
- 1025 Massachusetts Ave Unit 308
- 1025 Massachusetts Ave Unit 411
- 1025 Massachusetts Ave Unit 313
- 15 Longfellow Rd
- 25 Longfellow Rd
- 16 Longfellow Rd
- 18 Longfellow Rd
- 9 Longfellow Rd
- 22 Longfellow Rd
- 31 Longfellow Rd
- 7 Longfellow Rd
- 10 Longfellow Rd
- 26 Longfellow Rd
- 25 Ottawa Rd
- 206 Highland Ave
- 30 Longfellow Rd
- 6 Longfellow Rd
- 89 High Haith Rd
- 85 High Haith Rd
- 202 Highland Ave
- 17 Ottawa Rd
- 3 Longfellow Rd
- 218 Highland Ave