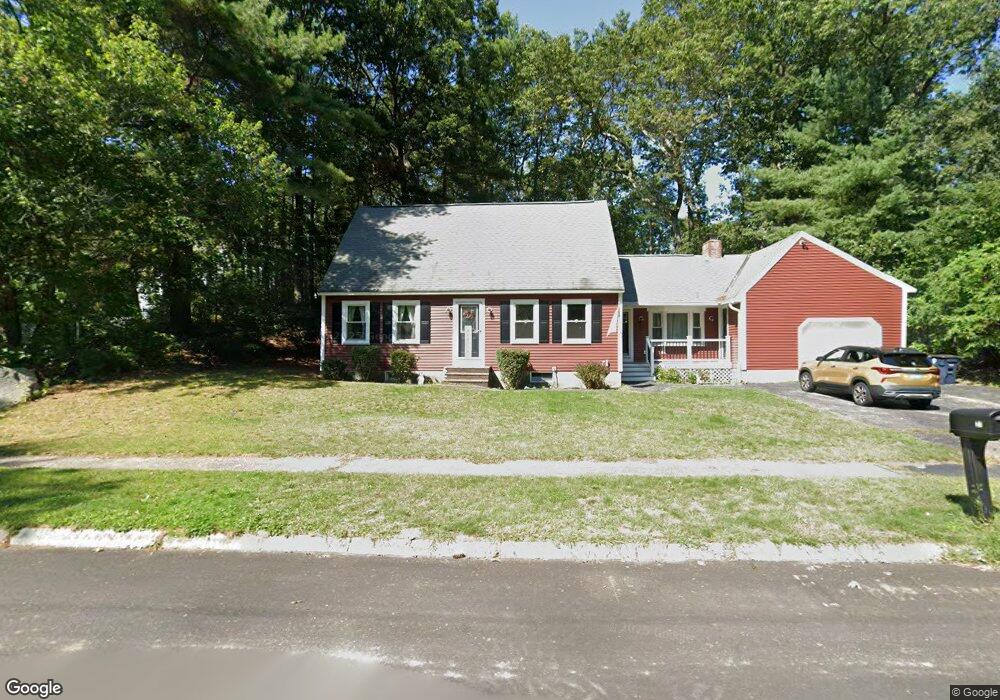
21 Michael Ave Nashua, NH 03062
West Hollis NeighborhoodEstimated Value: $595,647 - $806,000
3
Beds
2
Baths
1,846
Sq Ft
$361/Sq Ft
Est. Value
About This Home
This home is located at 21 Michael Ave, Nashua, NH 03062 and is currently estimated at $666,162, approximately $360 per square foot. 21 Michael Ave is a home located in Hillsborough County with nearby schools including Main Dunstable School, Elm Street Middle School, and Nashua High School South.
Ownership History
Date
Name
Owned For
Owner Type
Purchase Details
Closed on
Nov 8, 2018
Sold by
Harrington Joyce M and Harrington John F
Bought by
Harrington Joyce M
Current Estimated Value
Purchase Details
Closed on
May 13, 2010
Sold by
Landry Karen
Bought by
Harrington John F and Harrington Joyce M
Purchase Details
Closed on
Oct 19, 2005
Sold by
Donald Frost and Donald Deborah Frost
Bought by
Landry Karen
Home Financials for this Owner
Home Financials are based on the most recent Mortgage that was taken out on this home.
Original Mortgage
$227,850
Interest Rate
5.72%
Mortgage Type
Purchase Money Mortgage
Create a Home Valuation Report for This Property
The Home Valuation Report is an in-depth analysis detailing your home's value as well as a comparison with similar homes in the area
Home Values in the Area
Average Home Value in this Area
Purchase History
| Date | Buyer | Sale Price | Title Company |
|---|---|---|---|
| Harrington Joyce M | -- | -- | |
| Harrington John F | $249,000 | -- | |
| Landry Karen | $310,000 | -- |
Source: Public Records
Mortgage History
| Date | Status | Borrower | Loan Amount |
|---|---|---|---|
| Previous Owner | Landry Karen | $50,000 | |
| Previous Owner | Landry Karen | $125,000 | |
| Previous Owner | Landry Karen | $227,850 |
Source: Public Records
Tax History Compared to Growth
Tax History
| Year | Tax Paid | Tax Assessment Tax Assessment Total Assessment is a certain percentage of the fair market value that is determined by local assessors to be the total taxable value of land and additions on the property. | Land | Improvement |
|---|---|---|---|---|
| 2024 | $8,365 | $526,100 | $173,300 | $352,800 |
| 2023 | $7,976 | $437,500 | $138,700 | $298,800 |
| 2022 | $7,906 | $437,500 | $138,700 | $298,800 |
| 2021 | $7,379 | $317,800 | $97,000 | $220,800 |
| 2020 | $7,185 | $317,800 | $97,000 | $220,800 |
| 2019 | $6,915 | $317,800 | $97,000 | $220,800 |
| 2018 | $6,741 | $317,800 | $97,000 | $220,800 |
| 2017 | $6,546 | $253,800 | $77,600 | $176,200 |
| 2016 | $6,363 | $253,800 | $77,600 | $176,200 |
| 2015 | $6,226 | $253,800 | $77,600 | $176,200 |
| 2014 | $6,104 | $253,800 | $77,600 | $176,200 |
Source: Public Records
Map
Nearby Homes
- 375 Main Dunstable Rd
- 25 Cortez Dr Unit U57
- 16 Laurel Ct Unit U320
- 5 Wilderness Dr
- 15 Westray Dr
- 4 Chesapeake Rd
- 12 Spring Cove Rd Unit U103
- 47 Dogwood Dr Unit U202
- 188 Harris Rd
- 40 Spring Cove Rd Unit U117
- 58 Tanglewood Dr
- 4 Henry David Dr Unit 203
- 31 Tenby Dr
- 20 Martha St
- 8 Althea Ln Unit U26
- 23 Glen Dr
- 599 W Hollis St
- 33 Cannon Dr
- 46 Scenic Dr
- 12 Clovercrest Dr