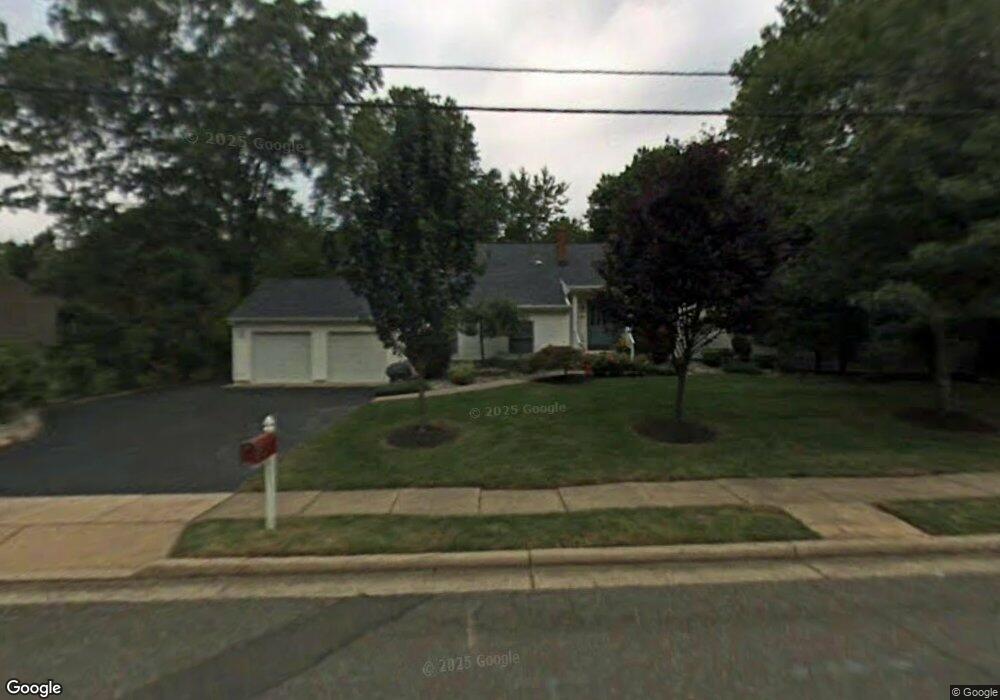
21 Midland Rd Edison, NJ 08820
Estimated Value: $860,173 - $1,000,000
4
Beds
3
Baths
2,314
Sq Ft
$398/Sq Ft
Est. Value
About This Home
This home is located at 21 Midland Rd, Edison, NJ 08820 and is currently estimated at $921,043, approximately $398 per square foot. 21 Midland Rd is a home located in Middlesex County with nearby schools including Martin Luther King Elementary School, Woodrow Wilson Middle School, and J.P. Stevens High School.
Ownership History
Date
Name
Owned For
Owner Type
Purchase Details
Closed on
Dec 12, 2016
Sold by
Bhat Ramachandra and Bhat Rejina
Bought by
Bhat Ramachandra and Bhat Rejina
Current Estimated Value
Home Financials for this Owner
Home Financials are based on the most recent Mortgage that was taken out on this home.
Original Mortgage
$395,000
Outstanding Balance
$324,345
Interest Rate
4.08%
Mortgage Type
New Conventional
Estimated Equity
$596,698
Purchase Details
Closed on
Jun 25, 2015
Sold by
Bodner Philip and Bodner Jayne
Bought by
Bhat Ramachandra and Bhat Rejina
Home Financials for this Owner
Home Financials are based on the most recent Mortgage that was taken out on this home.
Original Mortgage
$398,000
Interest Rate
3.88%
Mortgage Type
New Conventional
Create a Home Valuation Report for This Property
The Home Valuation Report is an in-depth analysis detailing your home's value as well as a comparison with similar homes in the area
Home Values in the Area
Average Home Value in this Area
Purchase History
| Date | Buyer | Sale Price | Title Company |
|---|---|---|---|
| Bhat Ramachandra | -- | None Available | |
| Bhat Ramachandra | $511,000 | Old Republic National Title |
Source: Public Records
Mortgage History
| Date | Status | Borrower | Loan Amount |
|---|---|---|---|
| Open | Bhat Ramachandra | $395,000 | |
| Closed | Bhat Ramachandra | $398,000 |
Source: Public Records
Tax History Compared to Growth
Tax History
| Year | Tax Paid | Tax Assessment Tax Assessment Total Assessment is a certain percentage of the fair market value that is determined by local assessors to be the total taxable value of land and additions on the property. | Land | Improvement |
|---|---|---|---|---|
| 2025 | $14,400 | $241,900 | $124,000 | $117,900 |
| 2024 | $14,323 | $241,900 | $124,000 | $117,900 |
Source: Public Records
Map
Nearby Homes
- 41 Oliver Ave
- 48 Lynnwood Rd
- 177 Mundy Ave
- 33 Nottingham Rd
- 8 Montclair Ave
- 24 Norton St
- 354 Plainfield Rd
- 51 Adams St
- 454 Plainfield Rd
- 10 Cutter Ave
- 73 Christie St
- 9 Links Dr
- 3996 Park Ave
- 21 Williams Rd
- 16 Stephenville Pkwy
- 12 Edgewood Rd
- 64 Richard Rd
- 3606 Springbrook Dr
- 4 David Ct
- 87 Ellmyer Rd