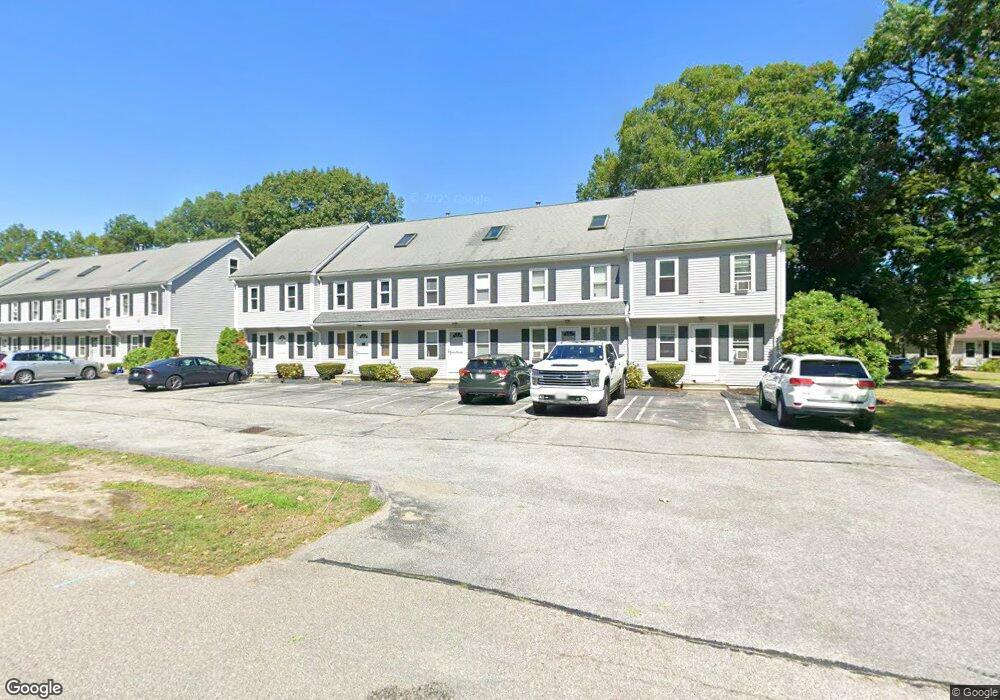
21 Milk St Unit B4 Attleboro, MA 02703
Estimated Value: $368,000 - $409,000
3
Beds
2
Baths
1,470
Sq Ft
$264/Sq Ft
Est. Value
About This Home
This home is located at 21 Milk St Unit B4, Attleboro, MA 02703 and is currently estimated at $387,877, approximately $263 per square foot. 21 Milk St Unit B4 is a home located in Bristol County with nearby schools including Thomas E. Willett School, Cyril K. Brennan Middle School, and Attleboro High School.
Ownership History
Date
Name
Owned For
Owner Type
Purchase Details
Closed on
Aug 11, 2015
Sold by
Kramer Christopher and Kramer Charles
Bought by
Cooper Stephanie
Current Estimated Value
Home Financials for this Owner
Home Financials are based on the most recent Mortgage that was taken out on this home.
Original Mortgage
$198,831
Outstanding Balance
$156,380
Interest Rate
4.03%
Mortgage Type
FHA
Estimated Equity
$231,497
Purchase Details
Closed on
Feb 28, 2007
Sold by
Branca William
Bought by
Kramer Christopher and Kramer Charles
Home Financials for this Owner
Home Financials are based on the most recent Mortgage that was taken out on this home.
Original Mortgage
$216,195
Interest Rate
6.27%
Mortgage Type
Purchase Money Mortgage
Create a Home Valuation Report for This Property
The Home Valuation Report is an in-depth analysis detailing your home's value as well as a comparison with similar homes in the area
Home Values in the Area
Average Home Value in this Area
Purchase History
| Date | Buyer | Sale Price | Title Company |
|---|---|---|---|
| Cooper Stephanie | $202,500 | -- | |
| Kramer Christopher | $225,000 | -- |
Source: Public Records
Mortgage History
| Date | Status | Borrower | Loan Amount |
|---|---|---|---|
| Open | Cooper Stephanie | $198,831 | |
| Previous Owner | Kramer Christopher | $216,195 |
Source: Public Records
Tax History
| Year | Tax Paid | Tax Assessment Tax Assessment Total Assessment is a certain percentage of the fair market value that is determined by local assessors to be the total taxable value of land and additions on the property. | Land | Improvement |
|---|---|---|---|---|
| 2025 | $4,322 | $344,400 | $0 | $344,400 |
| 2024 | $3,987 | $313,200 | $0 | $313,200 |
| 2023 | $3,631 | $265,200 | $0 | $265,200 |
| 2022 | $3,357 | $232,300 | $0 | $232,300 |
| 2021 | $3,025 | $204,400 | $0 | $204,400 |
| 2020 | $2,813 | $193,200 | $0 | $193,200 |
| 2019 | $2,714 | $191,700 | $0 | $191,700 |
| 2018 | $2,906 | $196,100 | $0 | $196,100 |
| 2017 | $2,890 | $198,600 | $0 | $198,600 |
| 2016 | $2,284 | $154,100 | $0 | $154,100 |
| 2015 | $2,415 | $164,200 | $0 | $164,200 |
| 2014 | $2,470 | $166,300 | $0 | $166,300 |
Source: Public Records
Map
Nearby Homes
- 26 West St
- 10 John St
- 15 North Ave
- 46 Berwick Rd
- 64 Mechanic St Unit 3
- 64 Mechanic St
- 75 Dennis St Unit 3
- 18-20 Jefferson St
- 21 4th St
- 0 Rosedale Ln Unit 73469293
- 49 Dennis St
- 32 Park St Unit 4
- 160 West St
- 147 County St
- 17 Capron St
- 28 Pine St Unit C
- 61 Pine St Unit 9
- 63 Hope St
- 37 Holman St
- 10 Hazelwood Ct
- 21 Milk St Unit B5
- 21 Milk St Unit B3
- 21 Milk St Unit B2
- 21 Milk St Unit B1
- 21 Milk St Unit 1
- 21 Milk St Unit 2
- 21 Milk St Unit 3
- 21 Milk St Unit 4
- 23 Milk St Unit A5
- 23 Milk St Unit A4
- 23 Milk St Unit A3
- 23 Milk St Unit A2
- 23 Milk St Unit A1
- 23 Milk St Unit 5
- 23 Milk St Unit 3
- 23 Milk St Unit 1
- 23 Milk St Unit 4
- 23 Milk St Unit 2
- 20 Water St
- 18 Water St
Your Personal Tour Guide
Ask me questions while you tour the home.