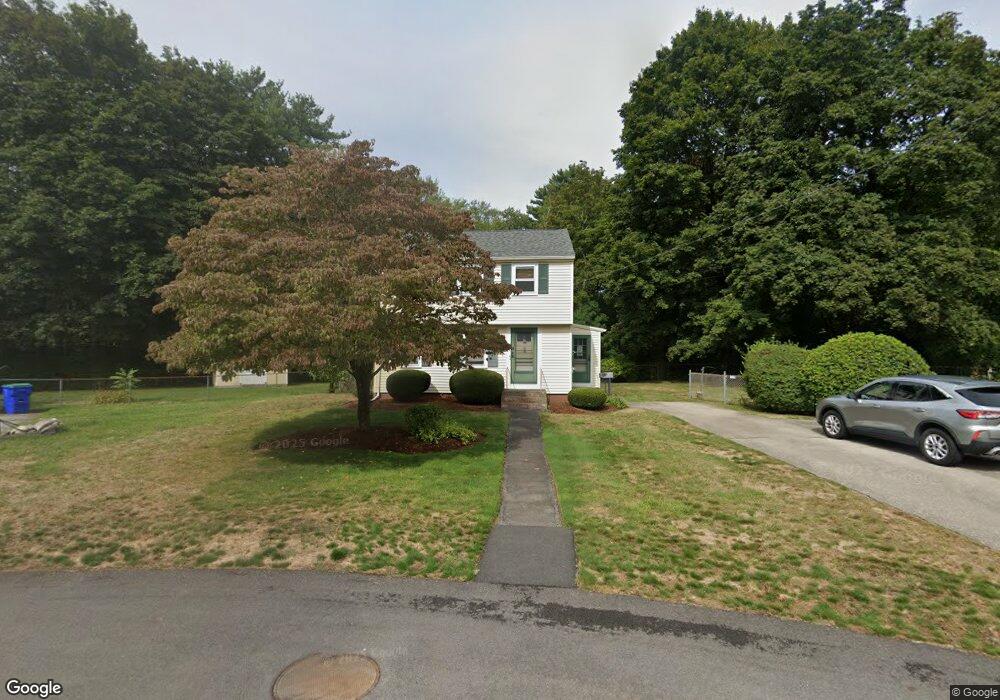
21 Moncrief Rd Rockland, MA 02370
Estimated Value: $469,000 - $547,000
3
Beds
1
Bath
1,080
Sq Ft
$475/Sq Ft
Est. Value
About This Home
This home is located at 21 Moncrief Rd, Rockland, MA 02370 and is currently estimated at $512,930, approximately $474 per square foot. 21 Moncrief Rd is a home located in Plymouth County with nearby schools including Rockland Senior High School, Calvary Chapel Academy, and Holy Family Elementary School.
Ownership History
Date
Name
Owned For
Owner Type
Purchase Details
Closed on
Jan 31, 1997
Sold by
Dewey Dana A and Dewey Cheryl A
Bought by
Odenweller Frances M
Current Estimated Value
Purchase Details
Closed on
May 30, 1989
Sold by
Coleman Eleanor
Bought by
Burke Charles L
Create a Home Valuation Report for This Property
The Home Valuation Report is an in-depth analysis detailing your home's value as well as a comparison with similar homes in the area
Home Values in the Area
Average Home Value in this Area
Purchase History
| Date | Buyer | Sale Price | Title Company |
|---|---|---|---|
| Odenweller Frances M | $128,000 | -- | |
| Burke Charles L | $154,000 | -- |
Source: Public Records
Mortgage History
| Date | Status | Borrower | Loan Amount |
|---|---|---|---|
| Open | Burke Charles L | $30,000 | |
| Open | Burke Charles L | $140,000 | |
| Closed | Burke Charles L | $30,000 |
Source: Public Records
Tax History Compared to Growth
Tax History
| Year | Tax Paid | Tax Assessment Tax Assessment Total Assessment is a certain percentage of the fair market value that is determined by local assessors to be the total taxable value of land and additions on the property. | Land | Improvement |
|---|---|---|---|---|
| 2025 | $6,038 | $441,700 | $226,700 | $215,000 |
| 2024 | $5,860 | $416,800 | $213,800 | $203,000 |
| 2023 | $5,822 | $382,500 | $196,100 | $186,400 |
| 2022 | $5,610 | $334,900 | $170,500 | $164,400 |
| 2021 | $5,269 | $304,900 | $155,000 | $149,900 |
| 2020 | $0 | $292,400 | $147,700 | $144,700 |
| 2019 | $6,579 | $280,500 | $140,700 | $139,800 |
| 2018 | $5,325 | $261,000 | $140,700 | $120,300 |
| 2017 | $5,175 | $250,200 | $140,700 | $109,500 |
| 2016 | $4,475 | $242,000 | $135,300 | $106,700 |
| 2015 | $4,274 | $224,600 | $126,400 | $98,200 |
| 2014 | $4,035 | $220,000 | $124,000 | $96,000 |
Source: Public Records
Map
Nearby Homes