21 Morgan St Oberlin, OH 44074
Estimated Value: $143,708 - $254,000
3
Beds
2
Baths
1,188
Sq Ft
$155/Sq Ft
Est. Value
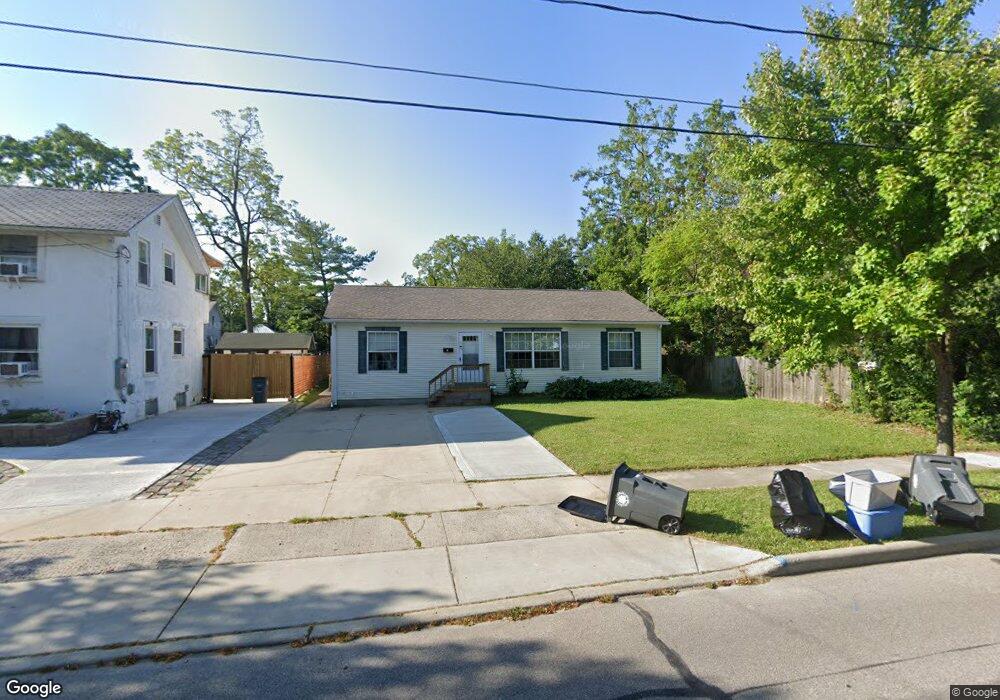
About This Home
This home is located at 21 Morgan St, Oberlin, OH 44074 and is currently estimated at $184,677, approximately $155 per square foot. 21 Morgan St is a home located in Lorain County with nearby schools including Oberlin Elementary School, Prospect Elementary School, and Langston Middle School.
Ownership History
Date
Name
Owned For
Owner Type
Purchase Details
Closed on
Jan 22, 2021
Sold by
Fang Huang and Lou Quhua
Bought by
Lui Alex
Current Estimated Value
Purchase Details
Closed on
Dec 24, 2013
Sold by
Meadows Mary T
Bought by
Fang Huang
Purchase Details
Closed on
Mar 28, 2006
Sold by
Washburn John M and Washburn Nancy L
Bought by
Meadows Mary T
Home Financials for this Owner
Home Financials are based on the most recent Mortgage that was taken out on this home.
Original Mortgage
$126,499
Interest Rate
6.33%
Mortgage Type
FHA
Purchase Details
Closed on
Mar 14, 2003
Sold by
Hembree Andrew R
Bought by
Washburn John M and Washburn Nancy L
Purchase Details
Closed on
Feb 28, 2003
Sold by
Hembree Rebekah L
Bought by
Washburn John M and Washburn Nancy L
Purchase Details
Closed on
Jul 23, 2001
Sold by
Estate Of Catherine I Hembree
Bought by
Metz Tracey I and Hembree William C
Purchase Details
Closed on
Aug 21, 1998
Sold by
Estate Of Irene Springer
Bought by
Springer Lawrence P and Hanak Donna
Create a Home Valuation Report for This Property
The Home Valuation Report is an in-depth analysis detailing your home's value as well as a comparison with similar homes in the area
Home Values in the Area
Average Home Value in this Area
Purchase History
| Date | Buyer | Sale Price | Title Company |
|---|---|---|---|
| Lui Alex | $50,000 | None Available | |
| Fang Huang | $105,000 | Lawyers Title Company | |
| Meadows Mary T | $127,500 | None Available | |
| Washburn John M | $17,500 | Elyria Land Title | |
| Washburn John M | -- | Elyria Land Title | |
| Washburn John M | -- | Elyria Land Title | |
| Metz Tracey I | -- | -- | |
| Springer Lawrence P | -- | -- |
Source: Public Records
Mortgage History
| Date | Status | Borrower | Loan Amount |
|---|---|---|---|
| Previous Owner | Meadows Mary T | $126,499 |
Source: Public Records
Tax History Compared to Growth
Tax History
| Year | Tax Paid | Tax Assessment Tax Assessment Total Assessment is a certain percentage of the fair market value that is determined by local assessors to be the total taxable value of land and additions on the property. | Land | Improvement |
|---|---|---|---|---|
| 2024 | $2,590 | $50,796 | $6,027 | $44,769 |
| 2023 | $2,138 | $37,503 | $5,894 | $31,609 |
| 2022 | $2,035 | $37,503 | $5,894 | $31,609 |
| 2021 | $2,084 | $37,503 | $5,894 | $31,609 |
| 2020 | $2,324 | $32,870 | $5,170 | $27,700 |
| 2019 | $2,305 | $32,870 | $5,170 | $27,700 |
| 2018 | $1,930 | $32,870 | $5,170 | $27,700 |
| 2017 | $1,920 | $33,990 | $4,930 | $29,060 |
| 2016 | $1,884 | $33,990 | $4,930 | $29,060 |
| 2015 | $1,886 | $33,990 | $4,930 | $29,060 |
| 2014 | $1,915 | $32,060 | $4,650 | $27,410 |
| 2013 | $1,792 | $32,060 | $4,650 | $27,410 |
Source: Public Records
Map
Nearby Homes
- 62 Locust St
- 44 W Vine St
- 81 S Professor St
- 83 S Pleasant St
- 147 Morgan St
- 149 Morgan St
- 360 S Main St
- 359 S Pleasant St
- 235 Elm St
- 257 Morgan St
- 232 Elm St
- 63 Spring St
- 263 W Lincoln St
- 111 N Pleasant St
- 182 E Hamilton St
- 246 W Hamilton St
- 110 Shipherd Cir
- 95 Shipherd Cir
- 216 N Main St
- 230 N Main St