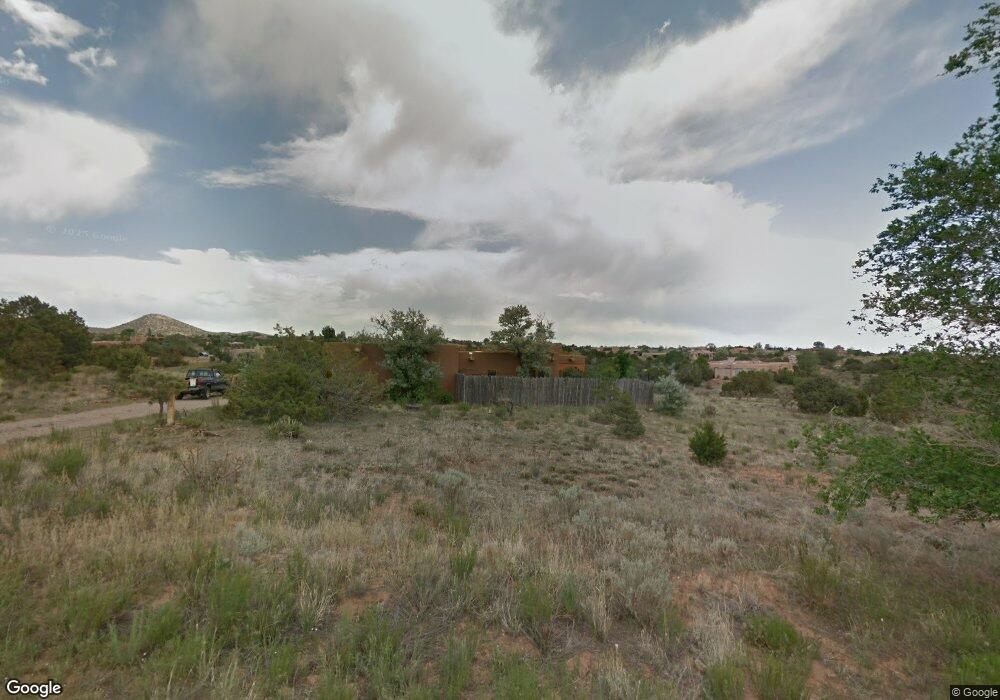
21 Moya Loop Santa Fe, NM 87508
Eldorado at Santa Fe NeighborhoodEstimated Value: $563,000 - $630,000
2
Beds
2
Baths
1,650
Sq Ft
$370/Sq Ft
Est. Value
About This Home
This home is located at 21 Moya Loop, Santa Fe, NM 87508 and is currently estimated at $610,467, approximately $369 per square foot. 21 Moya Loop is a home located in Santa Fe County with nearby schools including El Dorado Community School and Santa Fe High School.
Ownership History
Date
Name
Owned For
Owner Type
Purchase Details
Closed on
Mar 22, 2017
Sold by
Reed Elizabeth and The Elizabeth Reed Revocable T
Bought by
Warman Glen W and Warman Adams Judith L
Current Estimated Value
Home Financials for this Owner
Home Financials are based on the most recent Mortgage that was taken out on this home.
Original Mortgage
$339,968
Outstanding Balance
$281,085
Interest Rate
4.15%
Mortgage Type
VA
Estimated Equity
$329,382
Purchase Details
Closed on
May 1, 2012
Sold by
Reed Elizabeth
Bought by
Reed Elizabeth
Create a Home Valuation Report for This Property
The Home Valuation Report is an in-depth analysis detailing your home's value as well as a comparison with similar homes in the area
Home Values in the Area
Average Home Value in this Area
Purchase History
| Date | Buyer | Sale Price | Title Company |
|---|---|---|---|
| Warman Glen W | -- | First American Title Ins Co | |
| Reed Elizabeth | -- | None Available |
Source: Public Records
Mortgage History
| Date | Status | Borrower | Loan Amount |
|---|---|---|---|
| Open | Warman Glen W | $339,968 |
Source: Public Records
Tax History
| Year | Tax Paid | Tax Assessment Tax Assessment Total Assessment is a certain percentage of the fair market value that is determined by local assessors to be the total taxable value of land and additions on the property. | Land | Improvement |
|---|---|---|---|---|
| 2025 | $2,913 | $385,403 | $85,987 | $299,416 |
| 2024 | $2,999 | $374,179 | $83,483 | $290,696 |
| 2023 | $2,997 | $363,282 | $81,052 | $282,230 |
| 2022 | $2,819 | $352,702 | $78,692 | $274,010 |
| 2021 | $2,780 | $114,143 | $25,466 | $88,677 |
| 2020 | $2,746 | $111,581 | $23,799 | $87,782 |
| 2019 | $2,681 | $108,331 | $23,799 | $84,532 |
| 2018 | $2,618 | $105,176 | $23,799 | $81,377 |
| 2017 | $2,028 | $78,679 | $23,799 | $54,880 |
| 2016 | $1,901 | $76,388 | $28,783 | $47,605 |
| 2015 | $1,876 | $74,163 | $28,783 | $45,380 |
| 2014 | $1,911 | $80,503 | $28,755 | $51,748 |
Source: Public Records
Map
Nearby Homes
Your Personal Tour Guide
Ask me questions while you tour the home.