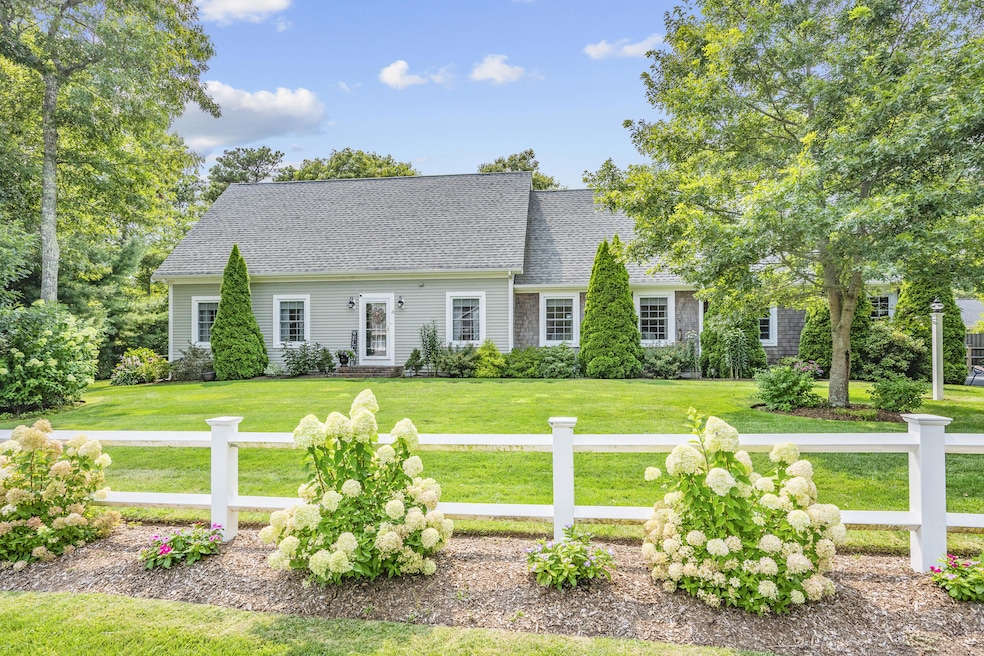
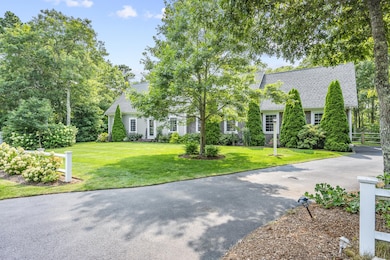
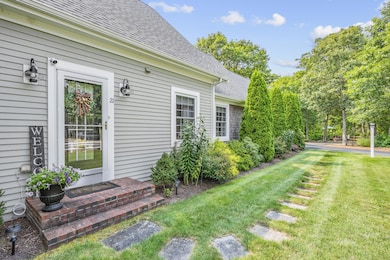
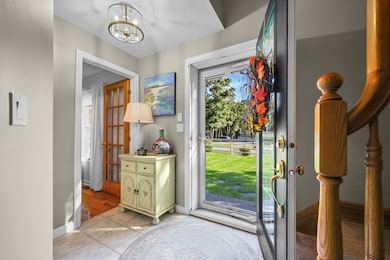
21 Nancys Way Brewster, MA 02631
Estimated payment $7,234/month
Highlights
- 1.38 Acre Lot
- Deck
- Main Floor Primary Bedroom
- Nauset Regional High School Rated A
- Wood Flooring
- No HOA
About This Home
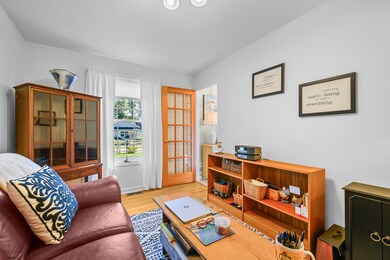
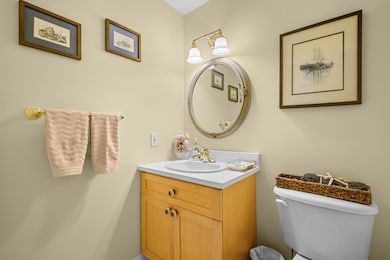
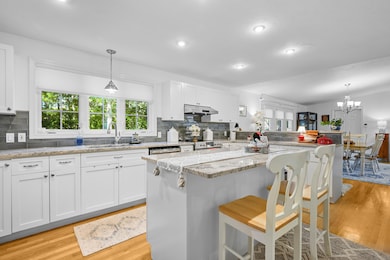
Welcome to a haven of tranquility, where perfect curb appeal greets you at this elegant Cape-style home, nestled on a serene 60,000 sq ft lot in the heart of Brewster. The beautifully landscaped yard sets the tone for the inviting ambiance inside, where 2,480 sq ft of light-filled living space awaits. Designed with entertaining in mind, the open floor plan seamlessly connects the spacious kitchen, living, and dining areas, extending to a deck that offers a view of the private backyard--a perfect spot to unwind. The main floor features a primary ensuite with a walk-in closet and private bath, while two additional guest rooms provide comfort upstairs. A private office caters to work-from-home needs, ensuring peace and productivity. Many recent updates enhance the home's appeal, including a new air conditioning system and bulkhead installed in September, complemented by a 2018 upgrade of the roof, siding, and gutters, along with a 2022 generator installation. Convenience is further elevated by an attached 2 car garage and first-floor washer and dryer. Situated with easy access to two ponds and a bike trail, this home offers an ideal blend of privacy and convenience.
Home Details
Home Type
- Single Family
Est. Annual Taxes
- $7,587
Year Built
- Built in 2003 | Remodeled
Parking
- 2 Car Garage
Home Design
- Poured Concrete
- Asphalt Roof
- Shingle Siding
- Concrete Perimeter Foundation
Interior Spaces
- 2,480 Sq Ft Home
- 2-Story Property
- Living Room
- Dining Area
Kitchen
- Electric Range
- Dishwasher
- Kitchen Island
Flooring
- Wood
- Carpet
- Tile
Bedrooms and Bathrooms
- 3 Bedrooms
- Primary Bedroom on Main
- Walk-In Closet
- Primary Bathroom is a Full Bathroom
Laundry
- Laundry on main level
- Washer
Basement
- Basement Fills Entire Space Under The House
- Interior Basement Entry
Utilities
- Central Air
- Heating Available
- Electric Water Heater
- Septic Tank
Additional Features
- Deck
- 1.38 Acre Lot
Community Details
- No Home Owners Association
Listing and Financial Details
- Assessor Parcel Number BREW M:52 B:154
Map
Home Values in the Area
Average Home Value in this Area
Tax History
| Year | Tax Paid | Tax Assessment Tax Assessment Total Assessment is a certain percentage of the fair market value that is determined by local assessors to be the total taxable value of land and additions on the property. | Land | Improvement |
|---|---|---|---|---|
| 2025 | $7,587 | $1,102,800 | $348,900 | $753,900 |
| 2024 | $7,229 | $1,061,500 | $357,800 | $703,700 |
| 2023 | $6,684 | $956,200 | $319,400 | $636,800 |
| 2022 | $6,271 | $798,800 | $266,100 | $532,700 |
| 2021 | $6,019 | $701,500 | $231,300 | $470,200 |
| 2020 | $5,690 | $660,100 | $212,800 | $447,300 |
| 2019 | $5,423 | $632,100 | $195,800 | $436,300 |
| 2018 | $5,225 | $632,600 | $195,800 | $436,800 |
| 2017 | $5,109 | $608,900 | $195,800 | $413,100 |
| 2016 | $4,775 | $566,400 | $174,500 | $391,900 |
| 2015 | $4,609 | $558,000 | $171,100 | $386,900 |
Property History
| Date | Event | Price | List to Sale | Price per Sq Ft |
|---|---|---|---|---|
| 10/13/2025 10/13/25 | Pending | -- | -- | -- |
| 10/08/2025 10/08/25 | For Sale | $1,250,000 | -- | $504 / Sq Ft |
Purchase History
| Date | Type | Sale Price | Title Company |
|---|---|---|---|
| Deed | -- | -- | |
| Deed | -- | -- | |
| Deed | -- | -- | |
| Deed | $159,900 | -- |
Mortgage History
| Date | Status | Loan Amount | Loan Type |
|---|---|---|---|
| Open | $207,000 | No Value Available | |
| Previous Owner | $180,000 | Purchase Money Mortgage | |
| Previous Owner | $240,000 | Purchase Money Mortgage |
Source: Cape Cod & Islands Association of REALTORS®
MLS Number: 22505051
APN: BREW-000052-000000-000154
Disclaimer: Certain information contained herein is derived from information provided by parties other than Homes.com. All information provided is deemed reliable, but is not guaranteed to be accurate and should be independently verified.
![]() All data relating to real estate for sale on this page comes from the Broker Reciprocity (BR) of the Cape Cod & Islands Multiple Listing Service, Inc. Detailed information about real estate listings held by brokerage firms other than CC&I Assoc. of REALTORS®, Inc. includes the name of the listing company. Neither the listing company nor CC&I Assoc. of REALTORS®, Inc. shall be responsible for any typographical errors, misinformation, misprints and shall be held totally harmless. The Broker providing this data believes it to be correct, but advises interested parties to confirm any item before relying on it in a purchase decision. All properties are subject to prior sale, changes, or withdrawal. Copyright 2025 © Cape Cod & Islands Multiple Listing Service, Inc. All rights reserved.
All data relating to real estate for sale on this page comes from the Broker Reciprocity (BR) of the Cape Cod & Islands Multiple Listing Service, Inc. Detailed information about real estate listings held by brokerage firms other than CC&I Assoc. of REALTORS®, Inc. includes the name of the listing company. Neither the listing company nor CC&I Assoc. of REALTORS®, Inc. shall be responsible for any typographical errors, misinformation, misprints and shall be held totally harmless. The Broker providing this data believes it to be correct, but advises interested parties to confirm any item before relying on it in a purchase decision. All properties are subject to prior sale, changes, or withdrawal. Copyright 2025 © Cape Cod & Islands Multiple Listing Service, Inc. All rights reserved.
