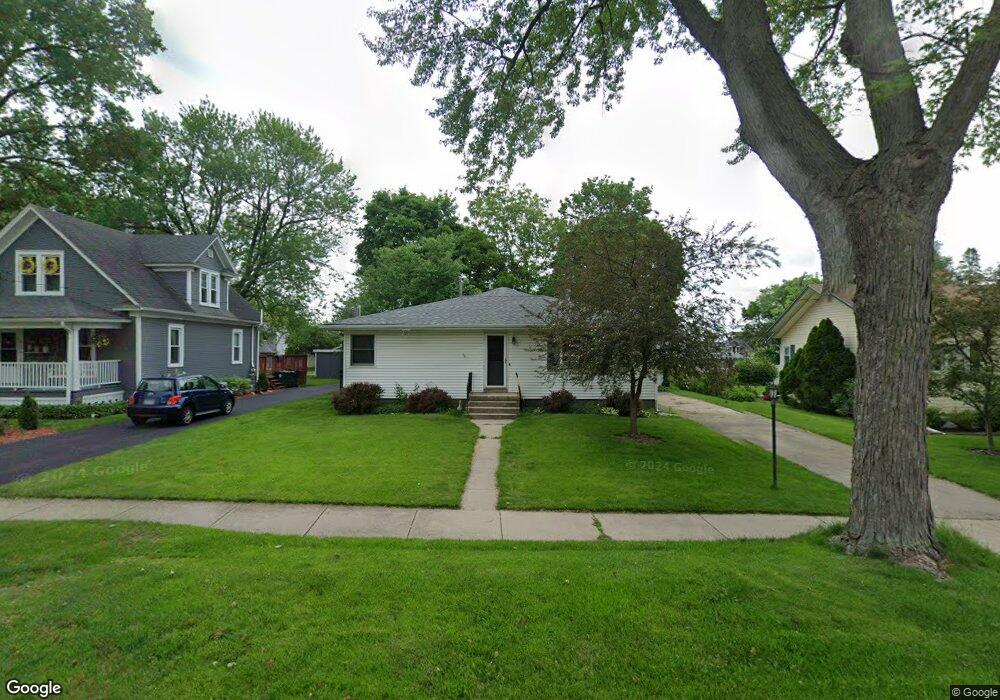
21 Park St Oswego, IL 60543
Downtown Oswego NeighborhoodEstimated Value: $268,123 - $340,000
Studio
--
Bath
1,463
Sq Ft
$208/Sq Ft
Est. Value
About This Home
This home is located at 21 Park St, Oswego, IL 60543 and is currently estimated at $304,281, approximately $207 per square foot. 21 Park St is a home located in Kendall County with nearby schools including Southbury Elementary School, Traughber Junior High School, and Oswego High School.
Ownership History
Date
Name
Owned For
Owner Type
Purchase Details
Closed on
May 31, 2023
Sold by
Secor Michael E
Bought by
Secor Michael E and Secor Steven K
Current Estimated Value
Purchase Details
Closed on
Aug 12, 2021
Sold by
Maureen Secor J and Maureen Secor J
Bought by
Secor Judith M
Home Financials for this Owner
Home Financials are based on the most recent Mortgage that was taken out on this home.
Original Mortgage
$130,000
Interest Rate
2.25%
Mortgage Type
New Conventional
Purchase Details
Closed on
Sep 23, 2008
Sold by
Secor J Maureen
Bought by
J Maureen Secor Self Declaration Of Tr
Purchase Details
Closed on
Jul 1, 1989
Create a Home Valuation Report for This Property
The Home Valuation Report is an in-depth analysis detailing your home's value as well as a comparison with similar homes in the area
Home Values in the Area
Average Home Value in this Area
Purchase History
| Date | Buyer | Sale Price | Title Company |
|---|---|---|---|
| Secor Michael E | -- | Stewart Title Guaranty Company | |
| Secor Judith M | -- | Accommodation | |
| J Maureen Secor Self Declaration Of Tr | -- | None Available | |
| -- | $100,000 | -- |
Source: Public Records
Mortgage History
| Date | Status | Borrower | Loan Amount |
|---|---|---|---|
| Previous Owner | Secor Judith M | $130,000 |
Source: Public Records
Tax History
| Year | Tax Paid | Tax Assessment Tax Assessment Total Assessment is a certain percentage of the fair market value that is determined by local assessors to be the total taxable value of land and additions on the property. | Land | Improvement |
|---|---|---|---|---|
| 2024 | $6,504 | $86,824 | $24,285 | $62,539 |
| 2023 | $0 | $76,162 | $21,303 | $54,859 |
| 2022 | $5,710 | $69,238 | $19,366 | $49,872 |
| 2021 | $3,685 | $67,880 | $18,986 | $48,894 |
| 2020 | $3,722 | $66,549 | $18,614 | $47,935 |
| 2019 | $3,781 | $66,074 | $18,614 | $47,460 |
| 2018 | $3,937 | $59,887 | $16,871 | $43,016 |
| 2017 | $4,531 | $55,195 | $15,549 | $39,646 |
| 2016 | $2,149 | $52,317 | $14,738 | $37,579 |
| 2015 | $4,288 | $50,305 | $14,171 | $36,134 |
| 2014 | -- | $48,370 | $13,626 | $34,744 |
| 2013 | -- | $50,386 | $14,194 | $36,192 |
Source: Public Records
Map
Nearby Homes
- 55 Garfield St
- 69 Monroe St
- 101 Bell Ct
- 238 Cooney Way
- 239 Cooney Way
- 403 Tanya Ln
- 343 Danforth Dr
- 713 Erwin St
- 236 Cooney Way
- 237 Cooney Way
- 206 E Washington St
- 1451 Vintage Dr
- 268 S Adams St
- 2240 State Route 31
- 371 S Madison St
- 429 Prairieview Dr
- 2110 State Route 31
- 3 Orchard Rd
- 123 Orchard Rd
- 2 Orchard Rd
- 15 Park St
- 27 Park St
- 26 E Jackson St
- 26 E Jackson Place
- 35 Park St
- 16 W Jackson St
- 28 E Jackson St Unit 30
- 125 Chicago Rd
- 117 Chicago Rd Unit 119
- 117-119 Chicago Rd
- 74 E Jefferson St
- 22 Park St
- 39 Park St
- 155 Chicago Rd
- 28 Park St
- 105 Chicago Rd
- 34 Park St
- 82 E Jefferson St
- 163 Chicago Rd Unit 165
- 47 Park St
Your Personal Tour Guide
Ask me questions while you tour the home.