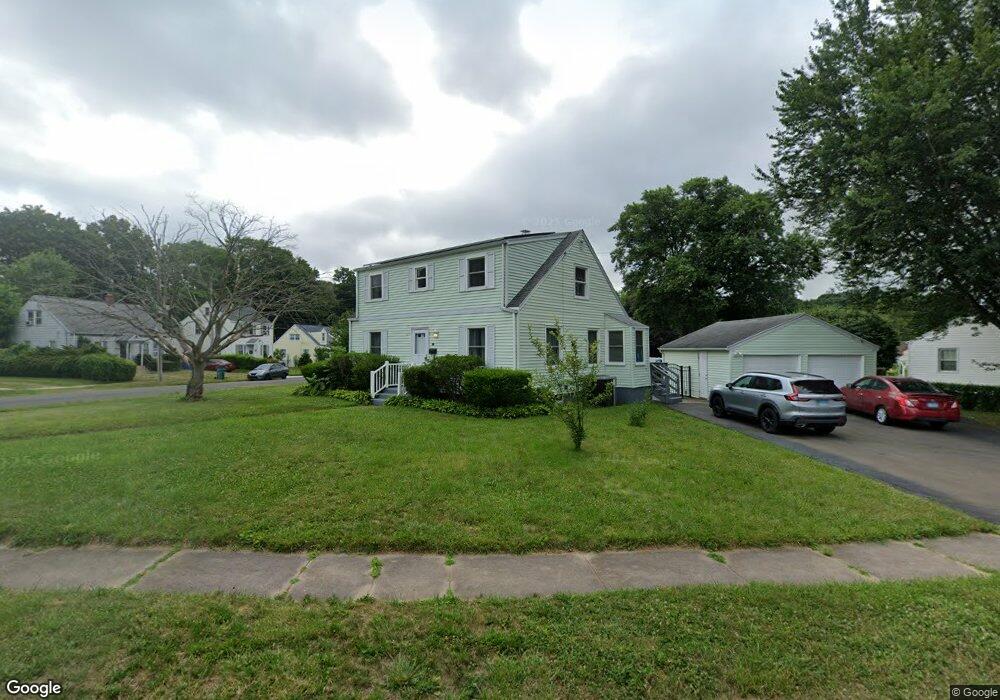
21 Pond Rd Hamden, CT 06514
Estimated Value: $355,584 - $401,000
3
Beds
2
Baths
1,418
Sq Ft
$263/Sq Ft
Est. Value
About This Home
This home is located at 21 Pond Rd, Hamden, CT 06514 and is currently estimated at $372,646, approximately $262 per square foot. 21 Pond Rd is a home located in New Haven County with nearby schools including Church Street School, Hamden Middle School, and Hamden High School.
Ownership History
Date
Name
Owned For
Owner Type
Purchase Details
Closed on
Aug 1, 2025
Sold by
Norris Joanna S
Bought by
Andrew Russell B
Current Estimated Value
Home Financials for this Owner
Home Financials are based on the most recent Mortgage that was taken out on this home.
Original Mortgage
$322,000
Outstanding Balance
$320,333
Interest Rate
6.81%
Mortgage Type
Future Advance Clause Open End Mortgage
Estimated Equity
$52,313
Purchase Details
Closed on
Apr 9, 2021
Sold by
Hilliard Kelly and Hilliard Colin
Bought by
Scaparotti Joanna E
Home Financials for this Owner
Home Financials are based on the most recent Mortgage that was taken out on this home.
Original Mortgage
$253,655
Interest Rate
3%
Mortgage Type
Purchase Money Mortgage
Purchase Details
Closed on
Jun 14, 2013
Sold by
Copela Peter M and Copela John J
Bought by
Hilliard Collin and Hilliard Kelly
Home Financials for this Owner
Home Financials are based on the most recent Mortgage that was taken out on this home.
Original Mortgage
$216,505
Interest Rate
3.39%
Mortgage Type
New Conventional
Create a Home Valuation Report for This Property
The Home Valuation Report is an in-depth analysis detailing your home's value as well as a comparison with similar homes in the area
Home Values in the Area
Average Home Value in this Area
Purchase History
| Date | Buyer | Sale Price | Title Company |
|---|---|---|---|
| Andrew Russell B | -- | -- | |
| Scaparotti Joanna E | $261,500 | None Available | |
| Scaparotti Joanna E | $261,500 | None Available | |
| Hilliard Collin | $220,000 | -- | |
| Hilliard Collin | $220,000 | -- |
Source: Public Records
Mortgage History
| Date | Status | Borrower | Loan Amount |
|---|---|---|---|
| Open | Andrew Russell B | $322,000 | |
| Previous Owner | Scaparotti Joanna E | $253,655 | |
| Previous Owner | Hilliard Collin | $216,505 |
Source: Public Records
Tax History
| Year | Tax Paid | Tax Assessment Tax Assessment Total Assessment is a certain percentage of the fair market value that is determined by local assessors to be the total taxable value of land and additions on the property. | Land | Improvement |
|---|---|---|---|---|
| 2025 | $11,501 | $221,690 | $62,300 | $159,390 |
| 2024 | $7,692 | $138,320 | $34,510 | $103,810 |
| 2023 | $8,300 | $147,210 | $34,510 | $112,700 |
| 2022 | $8,167 | $147,210 | $34,510 | $112,700 |
| 2021 | $7,720 | $147,210 | $34,510 | $112,700 |
| 2020 | $6,735 | $129,570 | $51,730 | $77,840 |
| 2019 | $6,331 | $129,570 | $51,730 | $77,840 |
| 2018 | $6,214 | $129,570 | $51,730 | $77,840 |
| 2017 | $5,864 | $129,570 | $51,730 | $77,840 |
| 2016 | $5,877 | $129,570 | $51,730 | $77,840 |
| 2015 | $5,656 | $138,390 | $63,840 | $74,550 |
| 2014 | $5,526 | $138,390 | $63,840 | $74,550 |
Source: Public Records
Map
Nearby Homes
- 12 Pond Rd
- 77 Blue Hills Ave
- 33 Bank St
- 84 Piper Rd
- 1422 Dixwell Ave
- 2 Village Cir Unit 2
- 1412 Dixwell Ave
- 125 Pearl Ave
- 33 Newton St
- 280 Lane St
- 365 Mather St Unit 198
- 365 Mather St Unit 63
- 365 Mather St Unit 128
- 191 Bradley Ave
- 63 Gorham Ave
- 61 Reyna Rd
- 290 Treadwell St Unit 1402
- 50 Pleasant Dr
- 33 W Helen St
- 82 Helen St
Your Personal Tour Guide
Ask me questions while you tour the home.