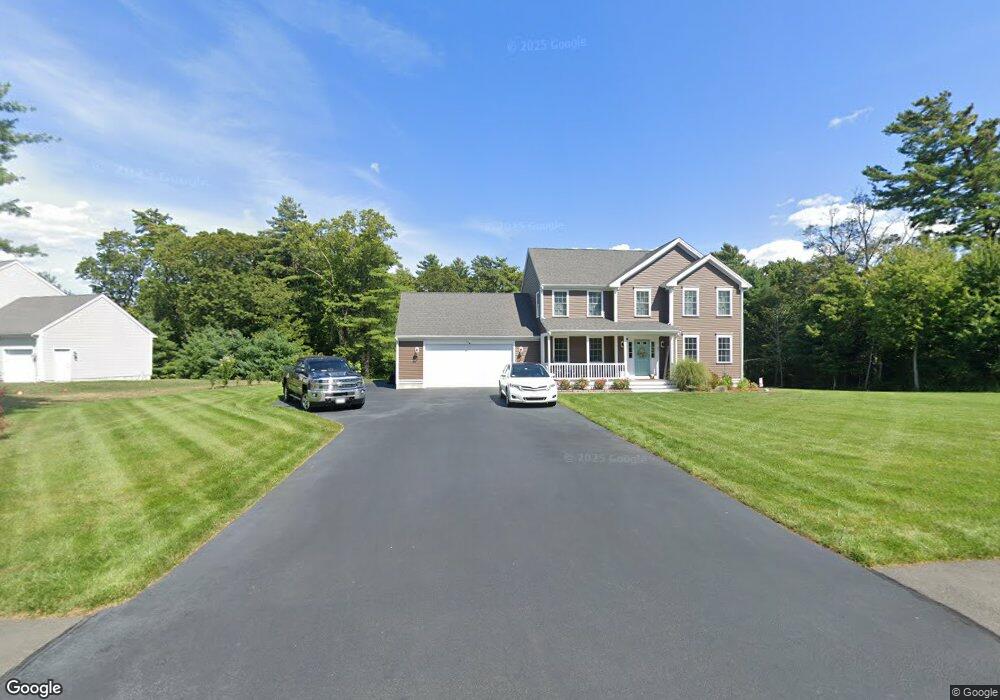
21 Ridge St Berkley, MA 02779
Camp Merriwood/Camp Welch NeighborhoodEstimated Value: $732,522 - $1,009,000
4
Beds
3
Baths
2,048
Sq Ft
$411/Sq Ft
Est. Value
About This Home
This home is located at 21 Ridge St, Berkley, MA 02779 and is currently estimated at $842,131, approximately $411 per square foot. 21 Ridge St is a home located in Bristol County with nearby schools including Berkley Community School.
Ownership History
Date
Name
Owned For
Owner Type
Purchase Details
Closed on
Sep 21, 2018
Sold by
Malloch Construction C
Bought by
Rebello Joseph and Rebello Christine E
Current Estimated Value
Home Financials for this Owner
Home Financials are based on the most recent Mortgage that was taken out on this home.
Original Mortgage
$384,000
Outstanding Balance
$334,181
Interest Rate
4.5%
Mortgage Type
New Conventional
Estimated Equity
$507,950
Purchase Details
Closed on
May 21, 2018
Sold by
Berkley Land Co Llc
Bought by
Malloch Construction C
Home Financials for this Owner
Home Financials are based on the most recent Mortgage that was taken out on this home.
Original Mortgage
$1,500,000
Interest Rate
4.4%
Mortgage Type
Unknown
Create a Home Valuation Report for This Property
The Home Valuation Report is an in-depth analysis detailing your home's value as well as a comparison with similar homes in the area
Home Values in the Area
Average Home Value in this Area
Purchase History
| Date | Buyer | Sale Price | Title Company |
|---|---|---|---|
| Rebello Joseph | $480,000 | -- | |
| Malloch Construction C | $190,000 | -- |
Source: Public Records
Mortgage History
| Date | Status | Borrower | Loan Amount |
|---|---|---|---|
| Open | Rebello Joseph | $384,000 | |
| Previous Owner | Malloch Construction C | $1,500,000 |
Source: Public Records
Tax History Compared to Growth
Tax History
| Year | Tax Paid | Tax Assessment Tax Assessment Total Assessment is a certain percentage of the fair market value that is determined by local assessors to be the total taxable value of land and additions on the property. | Land | Improvement |
|---|---|---|---|---|
| 2025 | $75 | $627,300 | $166,100 | $461,200 |
| 2024 | $8,305 | $667,100 | $224,600 | $442,500 |
| 2023 | $7,505 | $567,700 | $187,500 | $380,200 |
| 2022 | $7,486 | $544,400 | $183,900 | $360,500 |
| 2021 | $7,281 | $509,900 | $175,200 | $334,700 |
| 2020 | $7,221 | $497,000 | $155,300 | $341,700 |
| 2019 | $4,622 | $315,700 | $158,500 | $157,200 |
| 2018 | $1,377 | $98,200 | $98,200 | $0 |
| 2017 | $1,570 | $109,800 | $109,800 | $0 |
Source: Public Records
Map
Nearby Homes