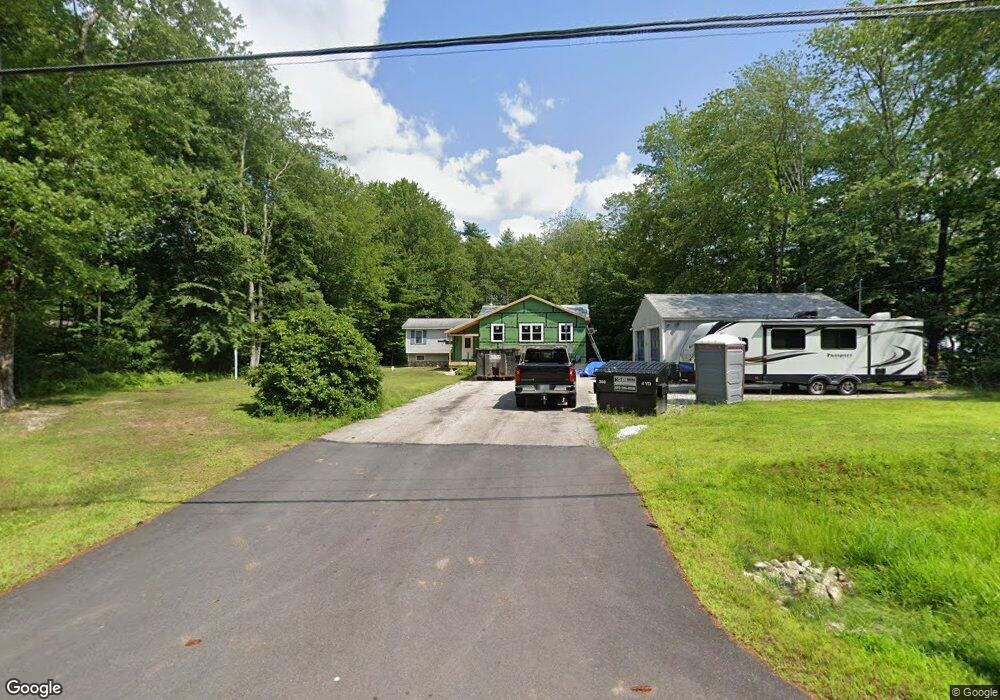
21 Roy St Raymond, NH 03077
Estimated Value: $442,581 - $479,000
3
Beds
2
Baths
1,980
Sq Ft
$234/Sq Ft
Est. Value
About This Home
This home is located at 21 Roy St, Raymond, NH 03077 and is currently estimated at $462,645, approximately $233 per square foot. 21 Roy St is a home located in Rockingham County with nearby schools including Lamprey River Elementary School, Iber Holmes Gove Middle School, and Raymond High School.
Ownership History
Date
Name
Owned For
Owner Type
Purchase Details
Closed on
Mar 4, 2008
Sold by
Yasika Ft
Bought by
Yasika Christopher P and Dion Michelle A
Current Estimated Value
Home Financials for this Owner
Home Financials are based on the most recent Mortgage that was taken out on this home.
Original Mortgage
$213,300
Outstanding Balance
$128,997
Interest Rate
5.8%
Mortgage Type
Purchase Money Mortgage
Estimated Equity
$333,648
Purchase Details
Closed on
Nov 1, 2000
Sold by
Yasika Douglas P and Yasika Joanne
Bought by
Yasika Bradley and Yasika Elizabeth S
Home Financials for this Owner
Home Financials are based on the most recent Mortgage that was taken out on this home.
Original Mortgage
$88,753
Interest Rate
7.83%
Purchase Details
Closed on
Oct 2, 1998
Sold by
Webb Robert C
Bought by
Yasika Douglas P and Yasika Joanne
Create a Home Valuation Report for This Property
The Home Valuation Report is an in-depth analysis detailing your home's value as well as a comparison with similar homes in the area
Home Values in the Area
Average Home Value in this Area
Purchase History
We collect this data history from publicly available records. To have your information removed, we recommend requesting removal directly through your county’s website.
| Date | Buyer | Sale Price | Title Company |
|---|---|---|---|
| Yasika Christopher P | $237,000 | -- | |
| Yasika Bradley | $89,500 | -- | |
| Yasika Douglas P | $52,500 | -- |
Source: Public Records
Mortgage History
We collect this data history from publicly available records. To have your information removed, we recommend requesting removal directly through your county’s website.
| Date | Status | Borrower | Loan Amount |
|---|---|---|---|
| Open | Yasika Douglas P | $213,300 | |
| Previous Owner | Yasika Douglas P | $88,753 |
Source: Public Records
Tax History
| Year | Tax Paid | Tax Assessment Tax Assessment Total Assessment is a certain percentage of the fair market value that is determined by local assessors to be the total taxable value of land and additions on the property. | Land | Improvement |
|---|---|---|---|---|
| 2025 | $8,511 | $370,700 | $111,600 | $259,100 |
| 2024 | $5,867 | $267,800 | $111,600 | $156,200 |
| 2023 | $5,549 | $267,800 | $111,600 | $156,200 |
| 2022 | $4,898 | $267,800 | $111,600 | $156,200 |
| 2021 | $4,957 | $267,800 | $111,600 | $156,200 |
| 2020 | $5,146 | $196,400 | $79,800 | $116,600 |
| 2019 | $5,222 | $196,400 | $79,800 | $116,600 |
| 2018 | $5,175 | $196,400 | $79,800 | $116,600 |
| 2017 | $4,753 | $196,400 | $79,800 | $116,600 |
| 2016 | $4,663 | $196,400 | $79,800 | $116,600 |
| 2015 | $4,630 | $184,600 | $79,800 | $104,800 |
| 2014 | $4,491 | $184,600 | $79,800 | $104,800 |
| 2013 | $4,364 | $184,600 | $79,800 | $104,800 |
Source: Public Records
Map
Nearby Homes
- 6 Power St
- 109 Langford Rd
- 7 Samantha Ave
- 0 Langford Rd Unit 77
- 15 Red Sox Ln Unit 15
- 14 Waterford Dr
- 15 Sargent Dr Unit 93
- 006 Bentley Cir
- 005 Bentley Cir Unit 5
- 59 Barberry Ln
- M20 L45 Green Rd
- 12 Watson Hill Rd
- 47 Long Hill Rd
- 88 Patten Hill Rd
- 31 Long Hill Rd
- 23 Main St Unit 1
- 23 Main St Unit 4
- 23 Main St Unit 3
- 112 Main St
- 125 Crowley Rd
Your Personal Tour Guide
Ask me questions while you tour the home.