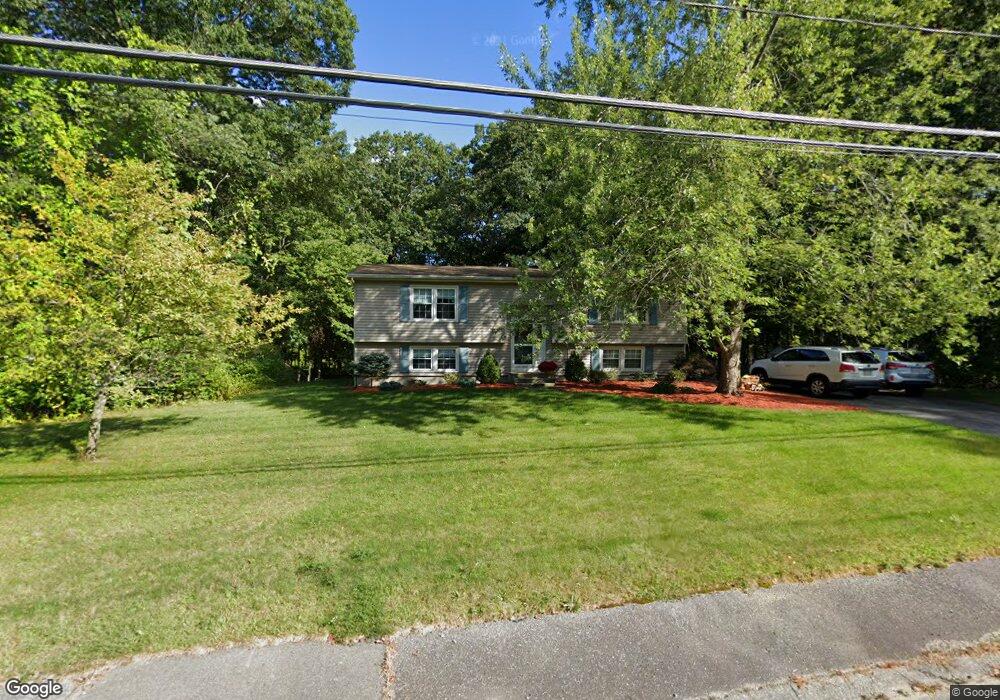
21 Ruby Rd Dracut, MA 01826
Estimated Value: $586,284 - $653,000
3
Beds
2
Baths
1,362
Sq Ft
$461/Sq Ft
Est. Value
About This Home
This home is located at 21 Ruby Rd, Dracut, MA 01826 and is currently estimated at $627,821, approximately $460 per square foot. 21 Ruby Rd is a home located in Middlesex County with nearby schools including Joseph A. Campbell Elementary School, Richardson Middle School, and Dracut Senior High School.
Ownership History
Date
Name
Owned For
Owner Type
Purchase Details
Closed on
Aug 24, 2023
Sold by
Albrecht Dennis M and Albrecht Mary B
Bought by
Mary Beth Albrecht Irt and Albrecht
Current Estimated Value
Purchase Details
Closed on
Mar 10, 1983
Bought by
Albrecht Dennis M and Albrecht Marybeth
Create a Home Valuation Report for This Property
The Home Valuation Report is an in-depth analysis detailing your home's value as well as a comparison with similar homes in the area
Home Values in the Area
Average Home Value in this Area
Purchase History
| Date | Buyer | Sale Price | Title Company |
|---|---|---|---|
| Mary Beth Albrecht Irt | -- | None Available | |
| Albrecht Dennis M | -- | -- |
Source: Public Records
Mortgage History
| Date | Status | Borrower | Loan Amount |
|---|---|---|---|
| Previous Owner | Albrecht Dennis M | $70,000 | |
| Previous Owner | Albrecht Dennis M | $15,000 | |
| Previous Owner | Albrecht Dennis M | $60,000 |
Source: Public Records
Tax History
| Year | Tax Paid | Tax Assessment Tax Assessment Total Assessment is a certain percentage of the fair market value that is determined by local assessors to be the total taxable value of land and additions on the property. | Land | Improvement |
|---|---|---|---|---|
| 2025 | $5,926 | $585,600 | $251,600 | $334,000 |
| 2024 | $6,041 | $578,100 | $239,700 | $338,400 |
| 2023 | $6,033 | $521,000 | $208,500 | $312,500 |
| 2022 | $5,566 | $452,900 | $189,600 | $263,300 |
| 2021 | $5,484 | $421,500 | $172,200 | $249,300 |
| 2020 | $5,172 | $387,400 | $167,000 | $220,400 |
| 2019 | $5,170 | $376,000 | $159,000 | $217,000 |
| 2018 | $7,717 | $353,900 | $159,000 | $194,900 |
| 2017 | $0 | $353,900 | $159,000 | $194,900 |
| 2016 | $4,765 | $321,100 | $159,800 | $161,300 |
| 2015 | $4,612 | $308,900 | $159,800 | $149,100 |
| 2014 | $4,401 | $303,700 | $159,800 | $143,900 |
Source: Public Records
Map
Nearby Homes
- 280 & 290 Spring Rd
- 5 Bailey Rd
- 290 Salem Rd
- 245 Salem Rd
- 298 Salem Rd
- 302 Salem Rd
- 23 Clough Dr
- 2 S Shore Dr
- 37 Summer Hill Rd
- 7 Little Island Park
- 170 E Richardson Rd
- 18 Stone Castle Dr Unit 76
- 785 Broadway Rd
- Lot 4 Canterbury Rd Unit 4
- 534 Forest St
- 45 Currier Rd
- 11 Wellesley Dr
- 296 Pelham St
- 3 Oxyoke Dr
- 28 Bridal Path Rd
Your Personal Tour Guide
Ask me questions while you tour the home.