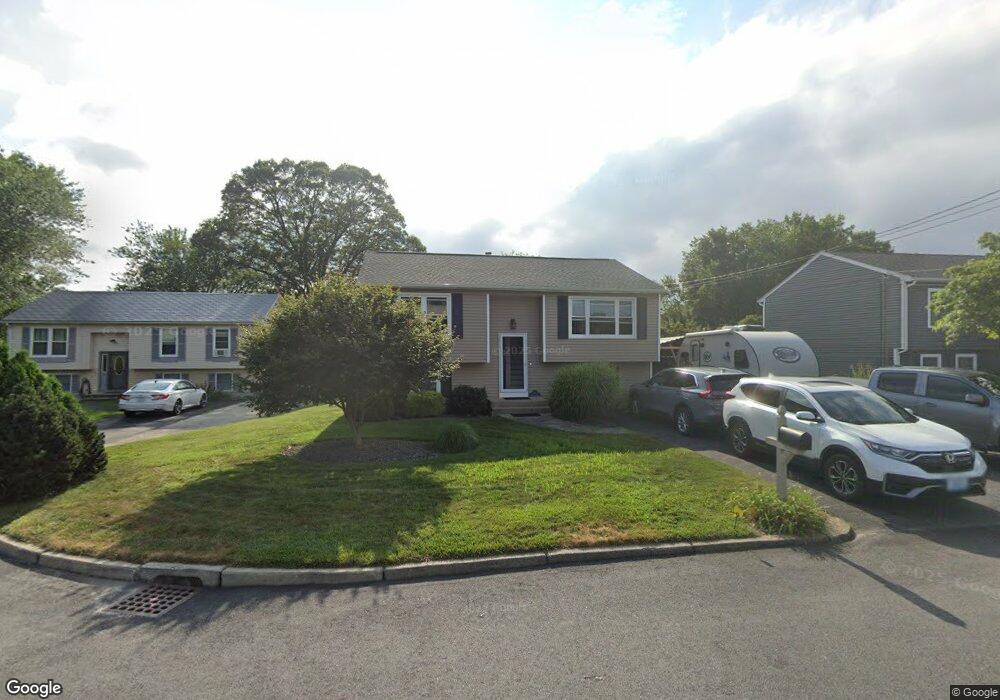
21 Samuel Ct Cranston, RI 02920
Mayfield NeighborhoodEstimated Value: $429,000 - $464,000
3
Beds
2
Baths
1,352
Sq Ft
$326/Sq Ft
Est. Value
About This Home
This home is located at 21 Samuel Ct, Cranston, RI 02920 and is currently estimated at $441,290, approximately $326 per square foot. 21 Samuel Ct is a home located in Providence County with nearby schools including Garden City School, Western Hills Middle School, and Cranston High School West.
Ownership History
Date
Name
Owned For
Owner Type
Purchase Details
Closed on
Aug 29, 2022
Sold by
Smith Michael
Bought by
Anthony Jayson S and Anthony Francesca R
Current Estimated Value
Purchase Details
Closed on
Jan 7, 2010
Sold by
Anthony Jason and Anthony Francesca
Bought by
Smith Michael J
Home Financials for this Owner
Home Financials are based on the most recent Mortgage that was taken out on this home.
Original Mortgage
$110,000
Interest Rate
4.78%
Mortgage Type
Purchase Money Mortgage
Purchase Details
Closed on
Jul 31, 2001
Sold by
Nunes Robert and Nunes Denise
Bought by
Anthony Jason S and Anthony Francesca R
Create a Home Valuation Report for This Property
The Home Valuation Report is an in-depth analysis detailing your home's value as well as a comparison with similar homes in the area
Home Values in the Area
Average Home Value in this Area
Purchase History
| Date | Buyer | Sale Price | Title Company |
|---|---|---|---|
| Anthony Jayson S | -- | None Available | |
| Smith Michael J | $210,000 | -- | |
| Anthony Jason S | $157,000 | -- |
Source: Public Records
Mortgage History
| Date | Status | Borrower | Loan Amount |
|---|---|---|---|
| Previous Owner | Anthony Jason S | $120,000 | |
| Previous Owner | Anthony Jason S | $110,000 | |
| Previous Owner | Anthony Jason S | $13,000 | |
| Previous Owner | Anthony Jason S | $142,000 |
Source: Public Records
Tax History Compared to Growth
Tax History
| Year | Tax Paid | Tax Assessment Tax Assessment Total Assessment is a certain percentage of the fair market value that is determined by local assessors to be the total taxable value of land and additions on the property. | Land | Improvement |
|---|---|---|---|---|
| 2025 | $5,038 | $363,000 | $113,900 | $249,100 |
| 2024 | $4,940 | $363,000 | $113,900 | $249,100 |
| 2023 | $4,680 | $247,600 | $75,000 | $172,600 |
| 2022 | $4,583 | $247,600 | $75,000 | $172,600 |
| 2021 | $4,457 | $247,600 | $75,000 | $172,600 |
| 2020 | $4,281 | $206,100 | $71,500 | $134,600 |
| 2019 | $4,281 | $206,100 | $71,500 | $134,600 |
| 2018 | $4,182 | $206,100 | $71,500 | $134,600 |
| 2017 | $4,262 | $185,800 | $64,300 | $121,500 |
| 2016 | $4,171 | $185,800 | $64,300 | $121,500 |
| 2015 | $4,171 | $185,800 | $64,300 | $121,500 |
| 2014 | $3,881 | $169,900 | $64,300 | $105,600 |
Source: Public Records
Map
Nearby Homes
- 33 Samuel Ct
- 16 Eastman St
- 16 Flynn Ave
- 10 East St Unit 316
- 10 East St Unit 205
- 112 Greenwich Ave
- 14 W Natick Rd
- 115 Edman St
- 61 Rose Hill Dr
- 123 Edman St
- 91 Ridgeway Rd
- 1002 Williamsburg Cir
- 995 Williamsburg Cir
- 142 Edaville Ct
- 28 Chatworth Ave
- 69 Haverhill Ave
- 846 Halifax Dr
- 765 Williamsburg Cir
- 794 Williamsburg Cir
- 20 Manor Rd