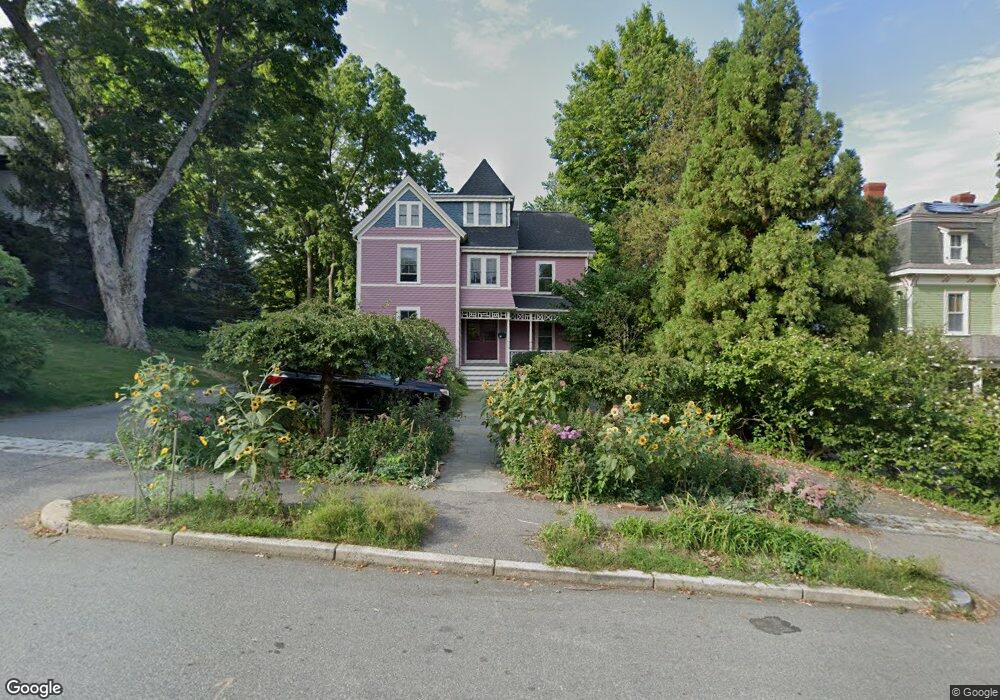
21 Shaw St West Newton, MA 02465
West Newton NeighborhoodEstimated Value: $1,068,000 - $1,308,000
4
Beds
2
Baths
2,085
Sq Ft
$550/Sq Ft
Est. Value
About This Home
This home is located at 21 Shaw St, West Newton, MA 02465 and is currently estimated at $1,146,874, approximately $550 per square foot. 21 Shaw St is a home located in Middlesex County with nearby schools including Franklin Elementary School, C.C. Burr, and F.A. Day Middle School.
Ownership History
Date
Name
Owned For
Owner Type
Purchase Details
Closed on
May 31, 2011
Sold by
Delaney Royston H
Bought by
Delaney Royston H and Delaney Ivy B
Current Estimated Value
Home Financials for this Owner
Home Financials are based on the most recent Mortgage that was taken out on this home.
Original Mortgage
$250,000
Outstanding Balance
$11,647
Interest Rate
4.94%
Mortgage Type
Purchase Money Mortgage
Estimated Equity
$1,135,227
Purchase Details
Closed on
Apr 11, 2008
Sold by
Lohman Amy B
Bought by
Delaney Royston H
Purchase Details
Closed on
Oct 30, 1996
Sold by
Lohman Amy B
Bought by
Osterman Leah G and King David C
Create a Home Valuation Report for This Property
The Home Valuation Report is an in-depth analysis detailing your home's value as well as a comparison with similar homes in the area
Home Values in the Area
Average Home Value in this Area
Purchase History
| Date | Buyer | Sale Price | Title Company |
|---|---|---|---|
| Delaney Royston H | -- | -- | |
| Delaney Royston H | -- | -- | |
| Delaney Royston H | -- | -- | |
| Delaney Royston H | $569,000 | -- | |
| Delaney Royston H | $569,000 | -- | |
| Osterman Leah G | $311,000 | -- | |
| Osterman Leah G | $311,000 | -- |
Source: Public Records
Mortgage History
| Date | Status | Borrower | Loan Amount |
|---|---|---|---|
| Open | Delaney Royston H | $250,000 | |
| Closed | Osterman Leah G | $250,000 |
Source: Public Records
Tax History Compared to Growth
Tax History
| Year | Tax Paid | Tax Assessment Tax Assessment Total Assessment is a certain percentage of the fair market value that is determined by local assessors to be the total taxable value of land and additions on the property. | Land | Improvement |
|---|---|---|---|---|
| 2025 | $8,992 | $917,600 | $0 | $917,600 |
| 2024 | $8,695 | $890,900 | $0 | $890,900 |
| 2023 | $8,466 | $831,600 | $0 | $831,600 |
| 2022 | $8,332 | $792,000 | $0 | $792,000 |
| 2021 | $8,040 | $747,200 | $0 | $747,200 |
| 2020 | $7,801 | $747,200 | $0 | $747,200 |
| 2019 | $7,580 | $725,400 | $0 | $725,400 |
| 2018 | $7,585 | $701,000 | $0 | $701,000 |
| 2017 | $7,354 | $661,300 | $0 | $661,300 |
| 2016 | $7,033 | $618,000 | $0 | $618,000 |
| 2015 | $6,834 | $588,600 | $0 | $588,600 |
Source: Public Records
Map
Nearby Homes
- 14 Cottage Place Unit 14
- 106 River St Unit 18
- 106 River St Unit 2
- 106 River St Unit 14
- 2 Elm St Unit 6
- 2 Elm St Unit 8
- 44 Westland Ave
- 56 Dearborn St
- 265-267 River St Unit 267
- 265-267 River St Unit 265
- 11 Randlett Park
- 12 Wiswall St
- 75 Cherry St
- 4 Wiswall St
- 10 Crescent St Unit 2
- 17 Crescent St
- 0 Duncan Rd Unit 72925240
- 321 Albemarle Rd
- 101-103 Lexington St
- 24 Tolman St Unit A
- 15 Henshaw St
- 59 Kilburn Rd
- 4 Henshaw Place
- 11 Henshaw St
- 36 Henshaw St Unit 3
- 36 Henshaw St Unit 2
- 36 Henshaw St Unit 1
- 36 Henshaw St Unit 2,36
- 16 Henshaw St
- 51 Kilburn Rd Unit 53
- 33 Henshaw St
- 9 Henshaw St
- 38 Henshaw St
- 38 Henshaw St Unit 1
- 10 Henshaw St
- 7 Henshaw Place
- 42 Henshaw St
- 42 Henshaw St Unit 1
- 42 Henshaw St Unit 2
- 5 Henshaw St