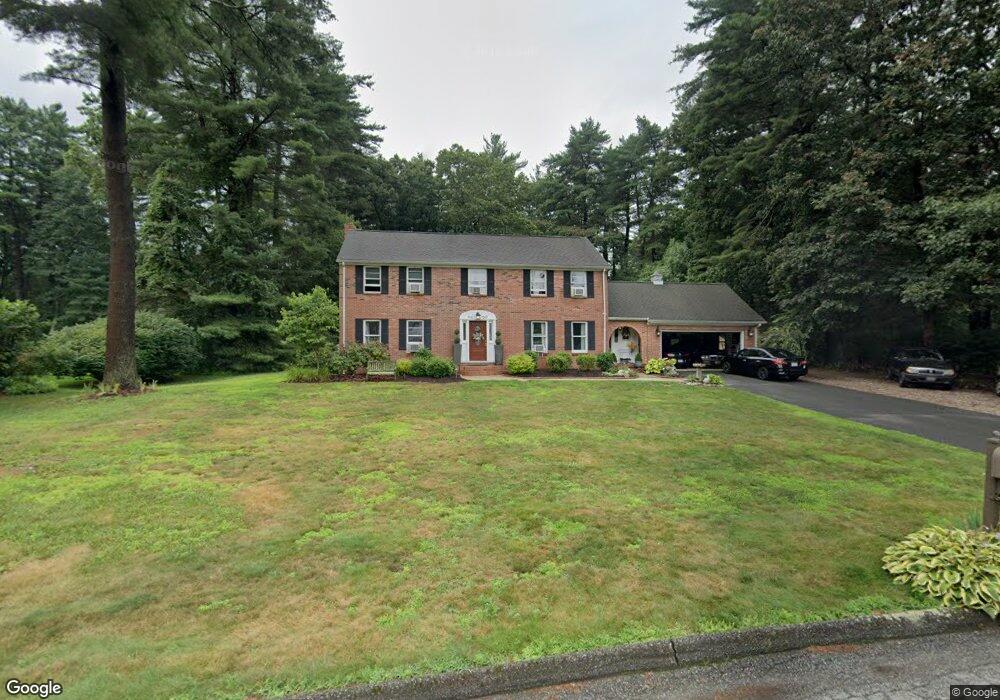
21 Shirley St Wilbraham, MA 01095
Estimated Value: $682,912 - $766,000
5
Beds
3
Baths
3,224
Sq Ft
$222/Sq Ft
Est. Value
About This Home
This home is located at 21 Shirley St, Wilbraham, MA 01095 and is currently estimated at $714,971, approximately $221 per square foot. 21 Shirley St is a home located in Hampden County with nearby schools including Minnechaug Regional High School, Springfield International Charter School, and Pioneer Valley Montessori School.
Ownership History
Date
Name
Owned For
Owner Type
Purchase Details
Closed on
Sep 12, 2011
Sold by
Gentile Calli A
Bought by
Gentile Michael M
Current Estimated Value
Purchase Details
Closed on
Jan 25, 2008
Sold by
Trigo Kevin A and Trigo Luann T
Bought by
Gentile Michael M and Gentile Calli A
Home Financials for this Owner
Home Financials are based on the most recent Mortgage that was taken out on this home.
Original Mortgage
$392,000
Interest Rate
6.17%
Mortgage Type
Purchase Money Mortgage
Purchase Details
Closed on
Dec 13, 1999
Sold by
Pickwick Inv Ltd
Bought by
Trigo Kevin A and Trigo Luann T
Home Financials for this Owner
Home Financials are based on the most recent Mortgage that was taken out on this home.
Original Mortgage
$204,000
Interest Rate
7.9%
Mortgage Type
Purchase Money Mortgage
Purchase Details
Closed on
Mar 1, 1999
Sold by
Leung Leung K and Leung Yuet M
Bought by
Pickwick Inv Ltd
Purchase Details
Closed on
Jun 30, 1987
Sold by
K-F Devel Inc
Bought by
Fernandez Mario G
Create a Home Valuation Report for This Property
The Home Valuation Report is an in-depth analysis detailing your home's value as well as a comparison with similar homes in the area
Home Values in the Area
Average Home Value in this Area
Purchase History
| Date | Buyer | Sale Price | Title Company |
|---|---|---|---|
| Gentile Michael M | -- | -- | |
| Gentile Michael M | $449,900 | -- | |
| Trigo Kevin A | $255,000 | -- | |
| Pickwick Inv Ltd | $100,000 | -- | |
| Fernandez Mario G | $325,542 | -- |
Source: Public Records
Mortgage History
| Date | Status | Borrower | Loan Amount |
|---|---|---|---|
| Previous Owner | Gentile Michael M | $392,000 | |
| Previous Owner | Fernandez Mario G | $23,000 | |
| Previous Owner | Fernandez Mario G | $204,000 | |
| Previous Owner | Fernandez Mario G | $65,000 |
Source: Public Records
Tax History
| Year | Tax Paid | Tax Assessment Tax Assessment Total Assessment is a certain percentage of the fair market value that is determined by local assessors to be the total taxable value of land and additions on the property. | Land | Improvement |
|---|---|---|---|---|
| 2025 | $10,801 | $604,100 | $122,300 | $481,800 |
| 2024 | $10,643 | $575,300 | $122,300 | $453,000 |
| 2023 | $9,710 | $526,200 | $122,300 | $403,900 |
| 2022 | $9,710 | $473,900 | $122,300 | $351,600 |
| 2021 | $9,629 | $419,400 | $127,900 | $291,500 |
| 2020 | $9,386 | $419,400 | $127,900 | $291,500 |
| 2019 | $9,143 | $419,400 | $127,900 | $291,500 |
| 2018 | $9,106 | $402,200 | $127,900 | $274,300 |
| 2017 | $8,848 | $402,200 | $127,900 | $274,300 |
| 2016 | $8,662 | $401,000 | $141,900 | $259,100 |
| 2015 | $8,373 | $401,000 | $141,900 | $259,100 |
Source: Public Records
Map
Nearby Homes
- 135 Pine Acre Rd
- 70 Quentin Rd
- 28 Old Lane Rd
- 2401 Wilbraham Rd
- 86 Peekskill Ave
- 367 Nassau Dr Unit 367
- 373 Nassau Dr
- 115 Senator St
- 2163 Wilbraham Rd
- 48 Castlegate Dr
- 147 Parkerview St
- 6V Melikian Dr
- 19 Marmon Ct
- 34 Flora St
- 39 Groton St
- 55 Parkerview St
- 15 Cedar Ridge Dr Unit 1
- 763 Stony Hill Rd
- 23 Rachael St
- 767 Stony Hill Rd
Your Personal Tour Guide
Ask me questions while you tour the home.