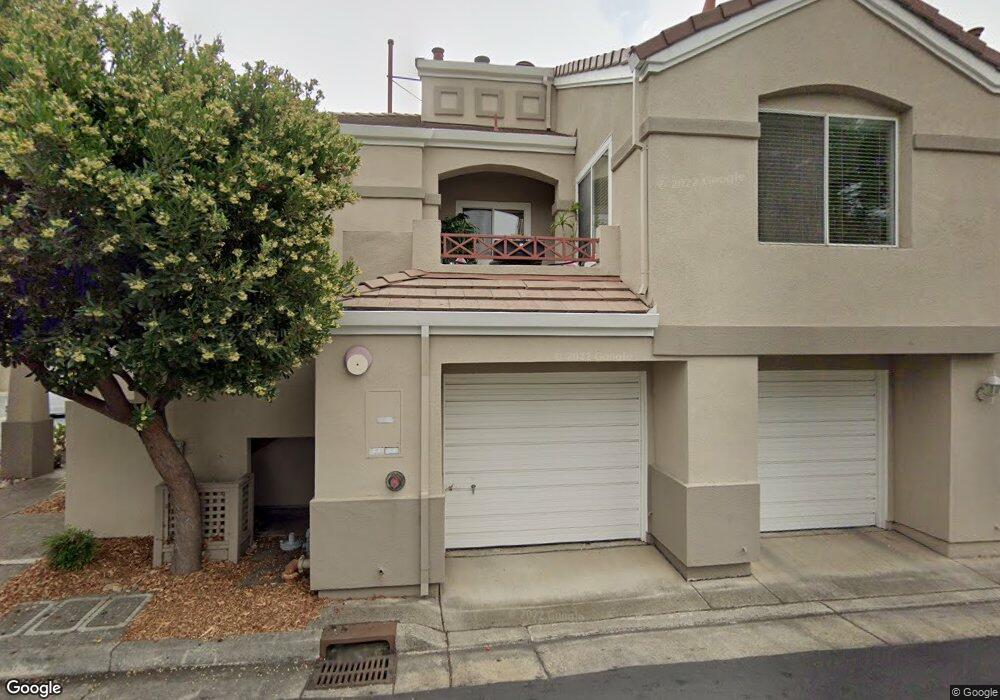
21 Torregata Loop San Jose, CA 95134
North San Jose NeighborhoodEstimated Value: $906,381 - $1,014,000
2
Beds
3
Baths
1,130
Sq Ft
$831/Sq Ft
Est. Value
About This Home
This home is located at 21 Torregata Loop, San Jose, CA 95134 and is currently estimated at $938,845, approximately $830 per square foot. 21 Torregata Loop is a home located in Santa Clara County with nearby schools including Don Callejon School, George Mayne Elementary School, and Adrian Wilcox High School.
Ownership History
Date
Name
Owned For
Owner Type
Purchase Details
Closed on
Jul 16, 2010
Sold by
Jian Jane and Tang Jane
Bought by
Jian Jane
Current Estimated Value
Home Financials for this Owner
Home Financials are based on the most recent Mortgage that was taken out on this home.
Original Mortgage
$150,000
Interest Rate
4.68%
Mortgage Type
New Conventional
Purchase Details
Closed on
Aug 26, 2008
Sold by
Lundquist Paul
Bought by
Tang Jane
Home Financials for this Owner
Home Financials are based on the most recent Mortgage that was taken out on this home.
Original Mortgage
$245,000
Outstanding Balance
$163,504
Interest Rate
6.59%
Mortgage Type
Purchase Money Mortgage
Estimated Equity
$775,341
Purchase Details
Closed on
Aug 25, 2008
Sold by
Tang Jay
Bought by
Tang Jane
Home Financials for this Owner
Home Financials are based on the most recent Mortgage that was taken out on this home.
Original Mortgage
$245,000
Outstanding Balance
$163,504
Interest Rate
6.59%
Mortgage Type
Purchase Money Mortgage
Estimated Equity
$775,341
Purchase Details
Closed on
Mar 9, 2000
Sold by
Dmitry Dimov and Marina Iofina
Bought by
Lundquist Paul
Home Financials for this Owner
Home Financials are based on the most recent Mortgage that was taken out on this home.
Original Mortgage
$297,600
Interest Rate
8.25%
Purchase Details
Closed on
May 18, 1998
Sold by
Raia Frederick S and Raia Nancy
Bought by
Dimov Dmitry and Iofina Marina
Home Financials for this Owner
Home Financials are based on the most recent Mortgage that was taken out on this home.
Original Mortgage
$250,000
Interest Rate
7.37%
Purchase Details
Closed on
Mar 9, 1998
Sold by
Kuykendall Tracy W and Kuykendall Susan M
Bought by
Raia Frederick S and Raia Nancy
Home Financials for this Owner
Home Financials are based on the most recent Mortgage that was taken out on this home.
Original Mortgage
$150,000
Interest Rate
7.11%
Purchase Details
Closed on
Feb 8, 1994
Sold by
Kaufman & Broad South Bay Inc
Bought by
Kuykendall Tracy Wayne and Kuykendall Susan Marie
Home Financials for this Owner
Home Financials are based on the most recent Mortgage that was taken out on this home.
Original Mortgage
$171,750
Interest Rate
3.87%
Create a Home Valuation Report for This Property
The Home Valuation Report is an in-depth analysis detailing your home's value as well as a comparison with similar homes in the area
Home Values in the Area
Average Home Value in this Area
Purchase History
| Date | Buyer | Sale Price | Title Company |
|---|---|---|---|
| Jian Jane | -- | First American Title | |
| Tang Jane | $481,000 | First American Title Company | |
| Tang Jane | -- | First American Title Company | |
| Lundquist Paul | $372,000 | Fidelity National Title Co | |
| Dimov Dmitry | $288,000 | Old Republic Title Company | |
| Raia Frederick S | $215,000 | Old Republic Title Company | |
| Kuykendall Tracy Wayne | $181,000 | First American Title Grnty C |
Source: Public Records
Mortgage History
| Date | Status | Borrower | Loan Amount |
|---|---|---|---|
| Closed | Jian Jane | $150,000 | |
| Open | Tang Jane | $245,000 | |
| Previous Owner | Lundquist Paul | $297,600 | |
| Previous Owner | Dimov Dmitry | $250,000 | |
| Previous Owner | Raia Frederick S | $150,000 | |
| Previous Owner | Kuykendall Tracy Wayne | $171,750 |
Source: Public Records
Tax History
| Year | Tax Paid | Tax Assessment Tax Assessment Total Assessment is a certain percentage of the fair market value that is determined by local assessors to be the total taxable value of land and additions on the property. | Land | Improvement |
|---|---|---|---|---|
| 2025 | $7,837 | $619,396 | $309,698 | $309,698 |
| 2024 | $7,837 | $607,252 | $303,626 | $303,626 |
| 2023 | $7,649 | $595,346 | $297,673 | $297,673 |
| 2022 | $7,548 | $583,674 | $291,837 | $291,837 |
| 2021 | $7,492 | $572,230 | $286,115 | $286,115 |
| 2020 | $7,344 | $566,364 | $283,182 | $283,182 |
| 2019 | $7,346 | $555,260 | $277,630 | $277,630 |
| 2018 | $6,861 | $544,374 | $272,187 | $272,187 |
| 2017 | $6,824 | $533,700 | $266,850 | $266,850 |
| 2016 | $6,695 | $523,236 | $261,618 | $261,618 |
| 2015 | $6,652 | $515,378 | $257,689 | $257,689 |
| 2014 | $6,316 | $505,284 | $252,642 | $252,642 |
Source: Public Records
Map
Nearby Homes
- 4169 Boneso Cir
- 4197 Sophia Way Unit 92
- 498 Summerland Dr
- 4271 N 1st St Unit 96
- 418 Pinefield Rd Unit 418
- 424 Shorewood Ln Unit 424
- 426 Shorewood Ln
- 304 Los Encinos St Unit 304
- 673 Hermitage Place Unit 673
- 237 El Bosque St
- 595 Hermitage Dr Unit 595
- 866 Spindrift Ln
- 818 Spindrift Ave
- 2130 Payne Place
- 4424 Lick Mill Blvd
- 4692 Wilcox Ave
- 4325 Watson Cir
- 1553 State St
- 1933 Silva Place
- 2231 Esperanca Ave
- 19 Torregata Loop Unit 169
- 27 Torregata Loop Unit 173
- 23 Torregata Loop
- 25 Torregata Loop Unit 172
- 15 Torregata Loop
- 24 Torregata Loop
- 13 Torregata Loop
- 17 Torregata Loop Unit 192
- 22 Torregata Loop
- 20 Torregata Loop
- 18 Torregata Loop Unit 175
- 16 Torregata Loop Unit 126
- 14 Torregata Loop Unit 177
- 11 Torregata Loop
- 31 Torregata Loop Unit 162
- 29 Torregata Loop Unit 161
- 33 Torregata Loop
- 12 Torregata Loop
- 10 Torregata Loop
- 35 Torregata Loop
Your Personal Tour Guide
Ask me questions while you tour the home.