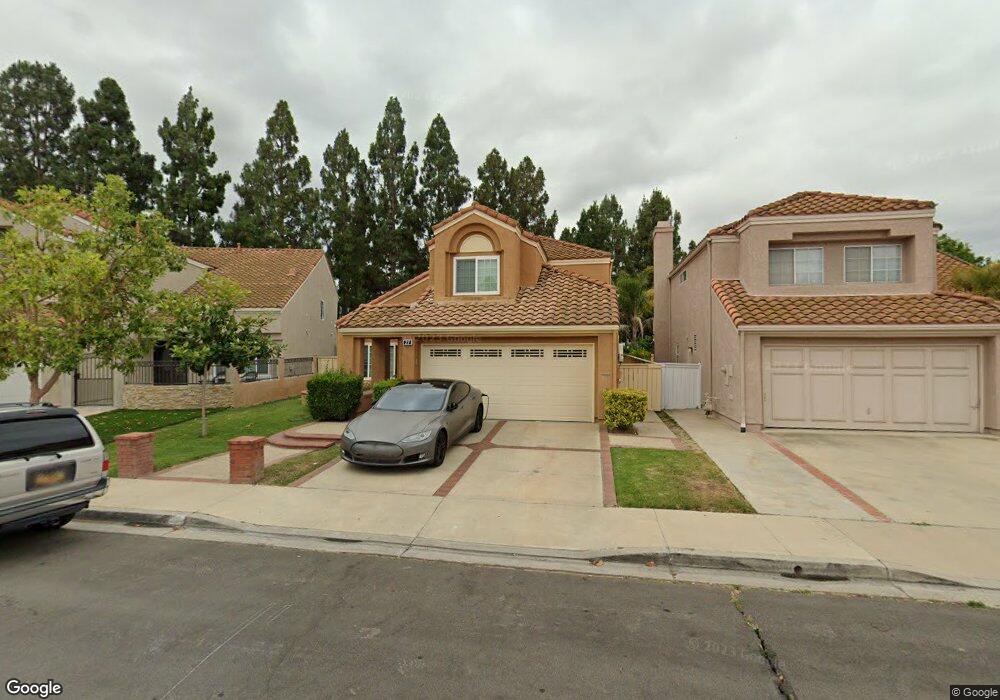
21 Trapani Irvine, CA 92614
Westpark NeighborhoodEstimated Value: $1,760,000 - $2,494,000
6
Beds
5
Baths
3,851
Sq Ft
$567/Sq Ft
Est. Value
About This Home
This home is located at 21 Trapani, Irvine, CA 92614 and is currently estimated at $2,181,908, approximately $566 per square foot. 21 Trapani is a home located in Orange County with nearby schools including Culverdale Elementary School, Westpark Elementary School, and South Lake Middle School.
Ownership History
Date
Name
Owned For
Owner Type
Purchase Details
Closed on
Jun 2, 2025
Sold by
Salim Habib and Salim Bilquis
Bought by
Salim Habib And Bilquis Salim Habib Revocable and Habib
Current Estimated Value
Purchase Details
Closed on
Jun 20, 2013
Sold by
Habib Salim and Habib Bilquis S
Bought by
Habib Salim and Habib Bilquis S
Purchase Details
Closed on
Nov 15, 2000
Sold by
Yeo Soo and Yoon Jin Soon
Bought by
Habib Salim and Gajiani Rauf
Home Financials for this Owner
Home Financials are based on the most recent Mortgage that was taken out on this home.
Original Mortgage
$145,000
Interest Rate
7.82%
Mortgage Type
Seller Take Back
Purchase Details
Closed on
Nov 14, 2000
Sold by
Habib Bilquis
Bought by
Habib Salim
Home Financials for this Owner
Home Financials are based on the most recent Mortgage that was taken out on this home.
Original Mortgage
$145,000
Interest Rate
7.82%
Mortgage Type
Seller Take Back
Create a Home Valuation Report for This Property
The Home Valuation Report is an in-depth analysis detailing your home's value as well as a comparison with similar homes in the area
Home Values in the Area
Average Home Value in this Area
Purchase History
| Date | Buyer | Sale Price | Title Company |
|---|---|---|---|
| Salim Habib And Bilquis Salim Habib Revocable | -- | None Listed On Document | |
| Habib Salim | -- | None Available | |
| Habib Salim | $645,000 | Orange C0ast Title | |
| Habib Salim | -- | Orange Coast Title |
Source: Public Records
Mortgage History
| Date | Status | Borrower | Loan Amount |
|---|---|---|---|
| Previous Owner | Habib Salim | $145,000 |
Source: Public Records
Tax History
| Year | Tax Paid | Tax Assessment Tax Assessment Total Assessment is a certain percentage of the fair market value that is determined by local assessors to be the total taxable value of land and additions on the property. | Land | Improvement |
|---|---|---|---|---|
| 2025 | $7,267 | $695,168 | $245,796 | $449,372 |
| 2024 | $7,267 | $681,538 | $240,977 | $440,561 |
| 2023 | $7,079 | $668,175 | $236,252 | $431,923 |
| 2022 | $6,942 | $655,074 | $231,620 | $423,454 |
| 2021 | $6,782 | $642,230 | $227,079 | $415,151 |
| 2020 | $6,744 | $635,645 | $224,750 | $410,895 |
| 2019 | $7,278 | $623,182 | $220,343 | $402,839 |
| 2018 | $7,160 | $610,963 | $216,022 | $394,941 |
| 2017 | $7,026 | $598,984 | $211,786 | $387,198 |
| 2016 | $6,746 | $587,240 | $207,634 | $379,606 |
| 2015 | $6,654 | $578,420 | $204,516 | $373,904 |
| 2014 | $6,538 | $567,090 | $200,510 | $366,580 |
Source: Public Records
Map
Nearby Homes
- 7 Galanto
- 17612 Webster Ave
- 3871 Hendrix St
- 14 Alcoba Unit 40
- 10 Laconia
- 5 Cannes
- 4 Alcira
- 114 Costero Aisle
- 18 Decente
- 94 Alicante Aisle Unit 133
- 4038 Germainder Way
- 21 Queens Wreath Way
- 55 Alicante Aisle
- 26 Claret Unit 40
- 53 Woodleaf
- 11 Rockrose Way
- 8 Cuzzano Aisle
- 41 Seton Rd
- 111 Greenfield
- 94 Greenfield Unit 99
Your Personal Tour Guide
Ask me questions while you tour the home.