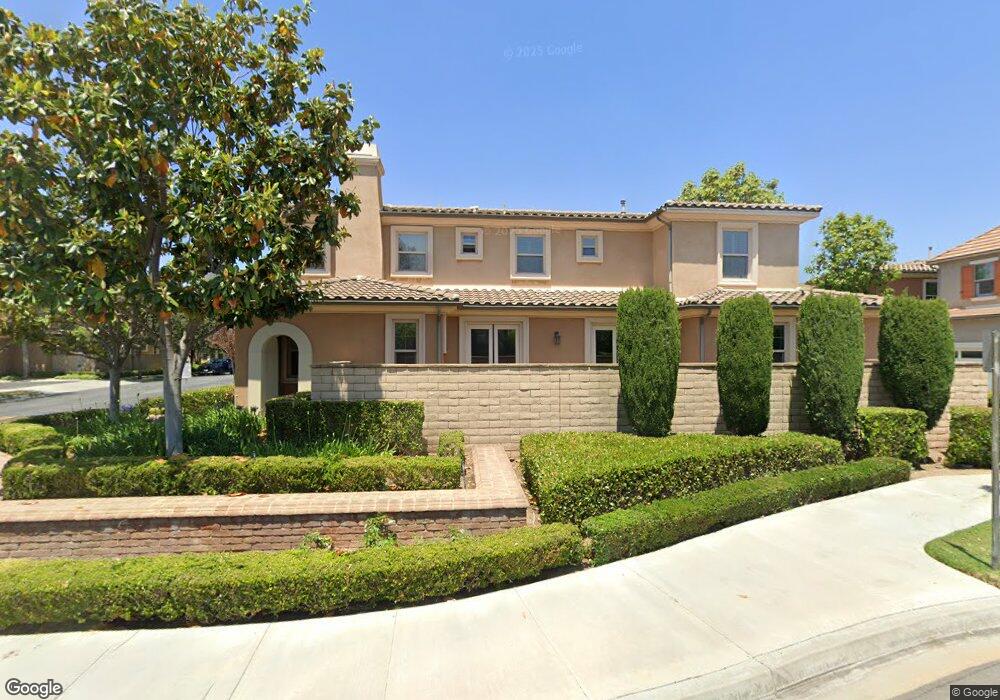
21 Twin Gables Unit 59 Irvine, CA 92620
Woodbury and Stonegate NeighborhoodEstimated Value: $1,755,646 - $1,898,000
4
Beds
3
Baths
2,429
Sq Ft
$749/Sq Ft
Est. Value
About This Home
This home is located at 21 Twin Gables Unit 59, Irvine, CA 92620 and is currently estimated at $1,820,412, approximately $749 per square foot. 21 Twin Gables Unit 59 is a home located in Orange County with nearby schools including Jeffrey Trail Middle, Portola High School, and New Horizon Elementary School.
Ownership History
Date
Name
Owned For
Owner Type
Purchase Details
Closed on
Nov 16, 2010
Sold by
Chen Janice
Bought by
Lee Jason
Current Estimated Value
Purchase Details
Closed on
May 26, 2009
Sold by
Chen Janice
Bought by
Chen Janice and Paris Trust
Purchase Details
Closed on
Jun 15, 2007
Sold by
Chen Janice
Bought by
Chen Janice and Janice Chen Living Trust
Purchase Details
Closed on
Jun 11, 2007
Sold by
Lee Jason and Chen Janice
Bought by
Chen Janice
Purchase Details
Closed on
Dec 20, 2006
Sold by
Chen Janice
Bought by
Lee Jason
Home Financials for this Owner
Home Financials are based on the most recent Mortgage that was taken out on this home.
Original Mortgage
$846,359
Interest Rate
6.22%
Mortgage Type
Purchase Money Mortgage
Purchase Details
Closed on
Nov 10, 2006
Sold by
Wl Homes Llc
Bought by
Lee Jason
Home Financials for this Owner
Home Financials are based on the most recent Mortgage that was taken out on this home.
Original Mortgage
$846,359
Interest Rate
6.22%
Mortgage Type
Purchase Money Mortgage
Create a Home Valuation Report for This Property
The Home Valuation Report is an in-depth analysis detailing your home's value as well as a comparison with similar homes in the area
Home Values in the Area
Average Home Value in this Area
Purchase History
| Date | Buyer | Sale Price | Title Company |
|---|---|---|---|
| Lee Jason | -- | None Available | |
| Chen Janice | -- | None Available | |
| Chen Janice | -- | None Available | |
| Chen Janice | -- | None Available | |
| Lee Jason | -- | Fidelity National Title Co | |
| Lee Jason | $1,058,000 | Fidelity National Title Co |
Source: Public Records
Mortgage History
| Date | Status | Borrower | Loan Amount |
|---|---|---|---|
| Previous Owner | Lee Jason | $846,359 |
Source: Public Records
Tax History Compared to Growth
Tax History
| Year | Tax Paid | Tax Assessment Tax Assessment Total Assessment is a certain percentage of the fair market value that is determined by local assessors to be the total taxable value of land and additions on the property. | Land | Improvement |
|---|---|---|---|---|
| 2025 | $12,642 | $1,010,842 | $578,233 | $432,609 |
| 2024 | $12,642 | $991,022 | $566,895 | $424,127 |
| 2023 | $12,978 | $971,591 | $555,780 | $415,811 |
| 2022 | $12,692 | $952,541 | $544,883 | $407,658 |
| 2021 | $12,479 | $933,864 | $534,199 | $399,665 |
| 2020 | $12,371 | $924,289 | $528,722 | $395,567 |
| 2019 | $12,844 | $906,166 | $518,355 | $387,811 |
| 2018 | $12,644 | $888,399 | $508,192 | $380,207 |
| 2017 | $12,450 | $870,980 | $498,228 | $372,752 |
| 2016 | $12,453 | $853,902 | $488,458 | $365,444 |
| 2015 | $12,242 | $841,076 | $481,121 | $359,955 |
| 2014 | $12,066 | $824,601 | $471,697 | $352,904 |
Source: Public Records
Map
Nearby Homes
- 25 Twin Gables
- 27 Twin Gables Unit 62
- 32 Long Fellow
- 30 Long Fellow
- 34 Long Fellow
- 29 Twin Gables Unit 63
- 24 Twin Gables
- 26 Long Fellow
- 31 Twin Gables
- 75 Mapleton
- 84 Mapleton Unit 50
- 24 Long Fellow
- 28 Long Fellow
- 33 Twin Gables Unit 65
- 80 Mapleton
- 86 Mapleton
- 88 Mapleton
- 30 Twin Gables
- 28 Twin Gables Unit 70
- 22 Long Fellow