Estimated Value: $1,317,000 - $1,528,000
4
Beds
2
Baths
2,180
Sq Ft
$648/Sq Ft
Est. Value
About This Home
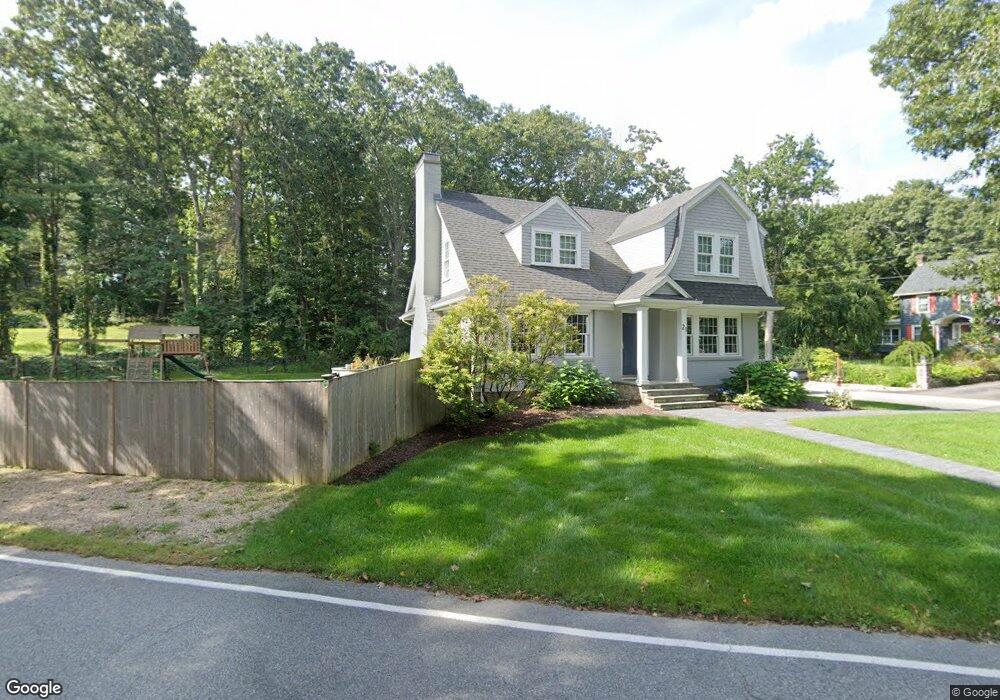
This home is located at 21 Whiting Rd, Dover, MA 02030 and is currently estimated at $1,411,969, approximately $647 per square foot. 21 Whiting Rd is a home located in Norfolk County with nearby schools including Chickering Elementary School, Dover-Sherborn Regional Middle School, and Dover-Sherborn Regional High School.
Ownership History
Date
Name
Owned For
Owner Type
Purchase Details
Closed on
Jan 31, 2014
Sold by
Zenger Blake R and Sampson-Zenger Diane
Bought by
Goodliss Adam and Becker Sara
Current Estimated Value
Home Financials for this Owner
Home Financials are based on the most recent Mortgage that was taken out on this home.
Original Mortgage
$548,000
Outstanding Balance
$416,193
Interest Rate
4.47%
Mortgage Type
Purchase Money Mortgage
Estimated Equity
$995,776
Purchase Details
Closed on
Jun 25, 2001
Sold by
Burgess Russel W and Burgess Karin W
Bought by
Zenger Blake R and Zanger Diane
Purchase Details
Closed on
Sep 10, 1996
Sold by
Hamlen Patricia W
Bought by
Burgess Russell W and Burgess Karin W
Create a Home Valuation Report for This Property
The Home Valuation Report is an in-depth analysis detailing your home's value as well as a comparison with similar homes in the area
Home Values in the Area
Average Home Value in this Area
Purchase History
| Date | Buyer | Sale Price | Title Company |
|---|---|---|---|
| Goodliss Adam | $685,000 | -- | |
| Zenger Blake R | $602,000 | -- | |
| Burgess Russell W | $268,000 | -- |
Source: Public Records
Mortgage History
| Date | Status | Borrower | Loan Amount |
|---|---|---|---|
| Open | Burgess Russell W | $548,000 | |
| Previous Owner | Burgess Russell W | $417,000 | |
| Previous Owner | Burgess Russell W | $435,000 |
Source: Public Records
Tax History
| Year | Tax Paid | Tax Assessment Tax Assessment Total Assessment is a certain percentage of the fair market value that is determined by local assessors to be the total taxable value of land and additions on the property. | Land | Improvement |
|---|---|---|---|---|
| 2025 | $12,908 | $1,145,300 | $495,800 | $649,500 |
| 2024 | $12,108 | $1,104,700 | $495,800 | $608,900 |
| 2023 | $11,691 | $959,100 | $432,700 | $526,400 |
| 2022 | $10,706 | $862,000 | $396,700 | $465,300 |
| 2021 | $10,880 | $844,100 | $396,700 | $447,400 |
| 2020 | $10,838 | $844,100 | $396,700 | $447,400 |
| 2019 | $10,914 | $844,100 | $396,700 | $447,400 |
| 2018 | $8,485 | $660,800 | $372,700 | $288,100 |
| 2017 | $8,462 | $648,400 | $372,700 | $275,700 |
| 2016 | $8,087 | $627,900 | $354,000 | $273,900 |
| 2015 | $7,907 | $622,600 | $354,000 | $268,600 |
Source: Public Records
Map
Nearby Homes
Your Personal Tour Guide
Ask me questions while you tour the home.