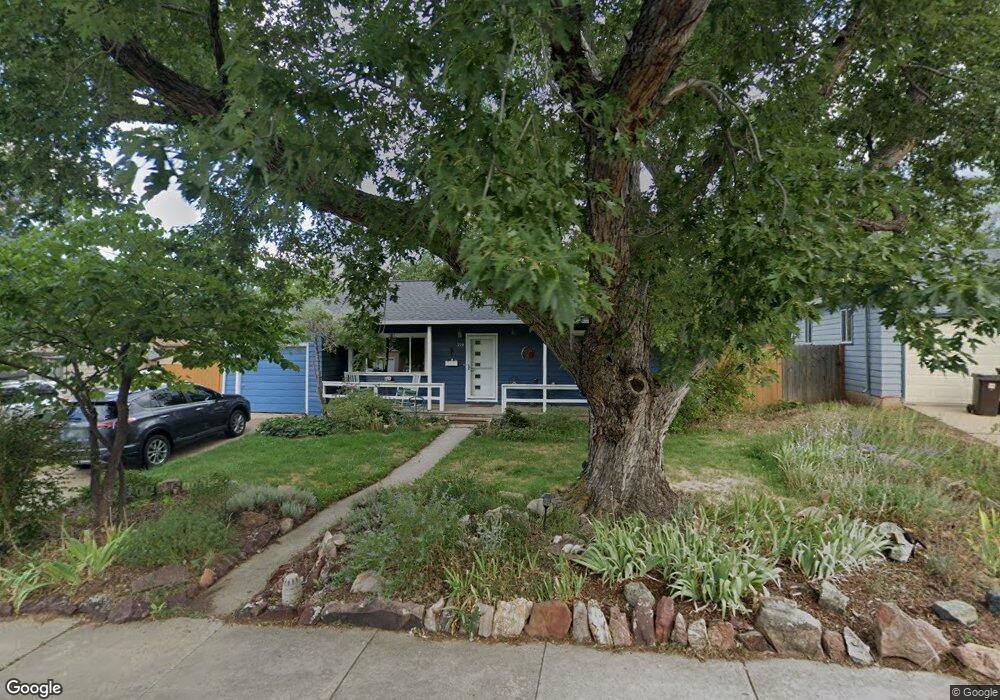
210 28th St Boulder, CO 80305
South Boulder NeighborhoodEstimated Value: $624,668 - $725,000
2
Beds
1
Bath
828
Sq Ft
$811/Sq Ft
Est. Value
About This Home
This home is located at 210 28th St, Boulder, CO 80305 and is currently estimated at $671,667, approximately $811 per square foot. 210 28th St is a home located in Boulder County with nearby schools including Creekside Elementary School, Manhattan Middle School of the Arts & Academics, and Fairview High School.
Ownership History
Date
Name
Owned For
Owner Type
Purchase Details
Closed on
Aug 1, 2006
Sold by
Smith John Mattingly
Bought by
Jernigan Rhonda G
Current Estimated Value
Home Financials for this Owner
Home Financials are based on the most recent Mortgage that was taken out on this home.
Original Mortgage
$246,000
Outstanding Balance
$147,855
Interest Rate
6.78%
Mortgage Type
Purchase Money Mortgage
Estimated Equity
$523,812
Purchase Details
Closed on
Jun 25, 1999
Sold by
Shaffer Andrew B and Shaffer Irene K
Bought by
Smith John Mattingly
Home Financials for this Owner
Home Financials are based on the most recent Mortgage that was taken out on this home.
Original Mortgage
$150,307
Interest Rate
7.11%
Mortgage Type
FHA
Purchase Details
Closed on
Mar 31, 1980
Bought by
Jernigan Rhonda G and Grissom Brad L
Create a Home Valuation Report for This Property
The Home Valuation Report is an in-depth analysis detailing your home's value as well as a comparison with similar homes in the area
Home Values in the Area
Average Home Value in this Area
Purchase History
| Date | Buyer | Sale Price | Title Company |
|---|---|---|---|
| Jernigan Rhonda G | $307,500 | Fahtco | |
| Smith John Mattingly | $175,000 | Land Title | |
| Jernigan Rhonda G | $61,500 | -- |
Source: Public Records
Mortgage History
| Date | Status | Borrower | Loan Amount |
|---|---|---|---|
| Open | Jernigan Rhonda G | $246,000 | |
| Previous Owner | Smith John Mattingly | $150,307 |
Source: Public Records
Tax History
| Year | Tax Paid | Tax Assessment Tax Assessment Total Assessment is a certain percentage of the fair market value that is determined by local assessors to be the total taxable value of land and additions on the property. | Land | Improvement |
|---|---|---|---|---|
| 2025 | $3,801 | $40,850 | $28,781 | $12,069 |
| 2024 | $3,801 | $40,850 | $28,781 | $12,069 |
| 2023 | $3,735 | $43,255 | $33,855 | $13,085 |
| 2022 | $3,408 | $36,703 | $25,639 | $11,064 |
| 2021 | $3,250 | $37,759 | $26,376 | $11,383 |
| 2020 | $3,086 | $35,450 | $25,383 | $10,067 |
| 2019 | $3,039 | $35,450 | $25,383 | $10,067 |
| 2018 | $2,817 | $32,494 | $23,400 | $9,094 |
| 2017 | $2,729 | $35,923 | $25,870 | $10,053 |
| 2016 | $2,274 | $26,268 | $15,920 | $10,348 |
| 2015 | $2,153 | $23,147 | $11,860 | $11,287 |
| 2014 | $1,946 | $23,147 | $11,860 | $11,287 |
Source: Public Records
Map
Nearby Homes
- 245 Fair Place
- 2221 Columbine Ave
- 2032 Mariposa Ave
- 370 20th St
- 3000 Dartmouth Ave
- 2141 Baseline Rd Unit 18
- 2030 Columbine Ave
- 805 29th St Unit 253
- 805 29th St Unit 157
- 805 29th St Unit 402
- 805 29th St Unit 404
- 2585 Kohler Dr
- 2800 Aurora Ave Unit 119
- 2850 Aurora Ave Unit 107
- 2955 Stanford Ave
- 780 33rd St
- 626 17th St
- 3805 Martin Dr
- 2235 Vassar Dr
- 345 S 38th St
Your Personal Tour Guide
Ask me questions while you tour the home.