NOT LISTED FOR SALE

210 Dean Forest Rd Savannah, GA 31408

Estimated Value: $257,000 - $625,000

3 Beds
3 Baths
1,938 Sq Ft
$184/Sq Ft Est. Value

Last Sold May 30, 2012

Last sale price $135,000 $70 Per Sq Ft

Est. 166% increase in value since last sale

Current estimated payment $2,012/month

About This Home

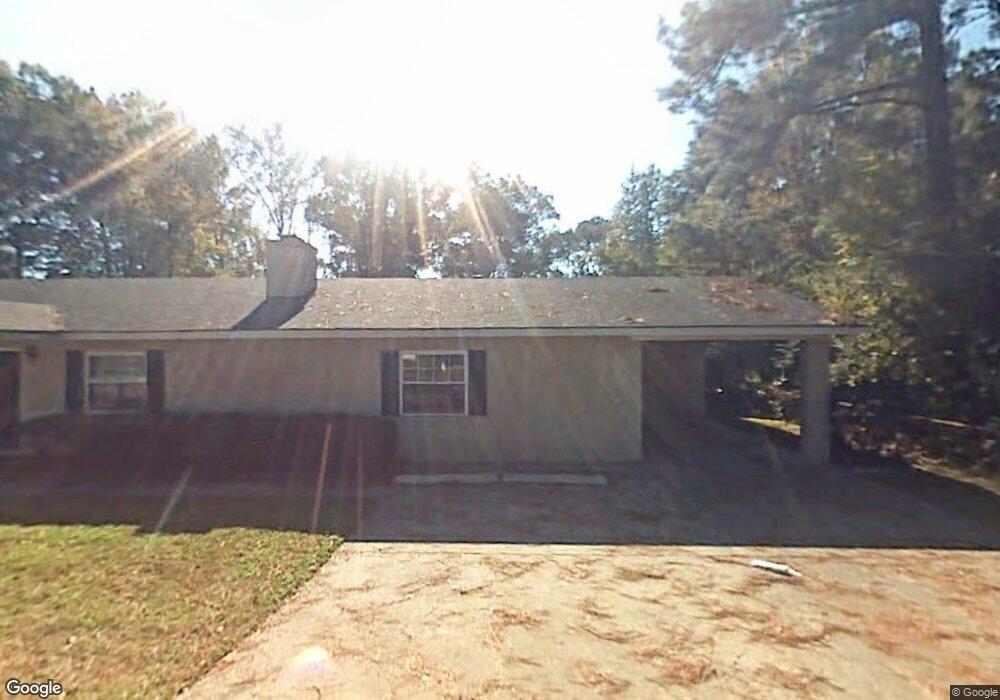
Nice home with updated kitchen, new laminate wood floors. Party house located in back with full bath with refrigerator/sink and covered porch. Bldg 30 x 40 on property can be used as a workshop or garage. 15 mins to Gulfstream

Ownership History

Date Name Owned For Owner Type

Purchase Details

Closed on
May 2, 2022
Sold by
Kratzer Sabine
Bought by
Parson Investment Properties Llc
Current Estimated Value
$358,556

Purchase Details

Closed on
Mar 16, 2022
Sold by
Kratzer Barry W
Bought by
Kratzer Sabine

Purchase Details

Closed on
May 30, 2012
Sold by
Edwards Mary M
Bought by
Kratzer Barry W and Kratzer Sabine

Home Financials for this Owner

Home Financials are based on the most recent Mortgage that was taken out on this home.
Original Mortgage
$135,000
Interest Rate
3.84%
Mortgage Type
VA

Purchase Details

Closed on
Feb 15, 2008
Sold by
Not Provided
Bought by
Edwards Mary Mildred
Source: Public Records

Range of Values:

--
Value Increase
--
Percent Increase
--
Adjusted for Inflation
Collateral Analytics

Collateral Analytics Collateral Analytics AVMs (Automated Valuation Model) employ a number of statistical approaches combined with neighborhood-specific comparable selection guarantees the most up-to-date and precise valuations.

Not Available

Collateral Analytics does not have data for the current month. Please view the chart for historical values.

ICE

ICE Mortgage Technology ICE Mortgage Technology’s AVM (Automated Valuation Model) is a state-of-the-art online residential property valuation tool that provides a quick and accurate estimate of the value of almost any home in the U.S.

Not Available

ICE Mortgage Technology does not have data for the current month. Please view the chart for historical values.

First American

First American First American Data & Analytics’ next-generation AVM combines unrivaled data assets with a blended ensemble of valuation models to produce highly accurate, reliable valuations you can trust.

Not Available

First American does not have data for the current month. Please view the chart for historical values.

Quantarium

Quantarium Quantarium’s valuation service, repeatedly proven the industry’s most accurate and comprehensive, is supercharged with a self-learning and auto-tuning AI engine that continually becomes smarter and more accurate as it processes daily inputs from the industry’s leading RE data lake.

Not Available

Quantarium does not have data for the current month. Please view the chart for historical values.

Average Value
Not Available
List Price
Sold Price
Create a Home Valuation Report for This Property
The Home Valuation Report is an in-depth analysis detailing your home's value as well as a comparison with similar homes in the area

Home Values in the Area

Source: Public Records

Average Home Value in this Area


Source: Public Records

Purchase History

Date Buyer Sale Price Title Company
Parson Investment Properties Llc $225,000 --
Kratzer Sabine -- --
Kratzer Barry W -- --
Kratzer Barry W $135,000 --
Edwards Mary Mildred -- --
Source: Public Records

Mortgage History

Date Status Borrower Loan Amount
Previous Owner Kratzer Barry W $135,000
Source: Public Records

Property History

Date Event Price List to Sale Price per Sq Ft Prior Sale
05/30/2012 05/30/12 Sold $135,000 -15.1% $70 / Sq Ft View Prior Sale
04/06/2012 04/06/12 Pending -- -- --
05/25/2011 05/25/11 For Sale $159,000 -- $82 / Sq Ft

Tax History Compared to Growth

Source: Public Records

Tax History

Year Tax Paid Tax Assessment Tax Assessment Total Assessment is a certain percentage of the fair market value that is determined by local assessors to be the total taxable value of land and additions on the property. Land Improvement
2025 $1,517 $24,880 $24,880 $0
2024 $1,517 $24,880 $24,880 $0
2023 $1,954 $63,200 $24,880 $38,320
2022 $0 $43,800 $10,000 $33,800
2021 $0 $44,440 $10,000 $34,440
2020 $1,155 $44,440 $10,000 $34,440
2019 $1,155 $44,440 $10,000 $34,440
2018 $1,061 $44,080 $10,000 $34,080
2017 $1,053 $45,240 $10,000 $35,240
2016 $1,053 $45,760 $10,720 $35,040
2015 $1,025 $42,200 $10,680 $31,520
2014 $1,515 $43,000 $0 $0
Source: Public Records

Agents Affiliated with this Home

  • Section Image
  • Section Image
See All Agents

Map