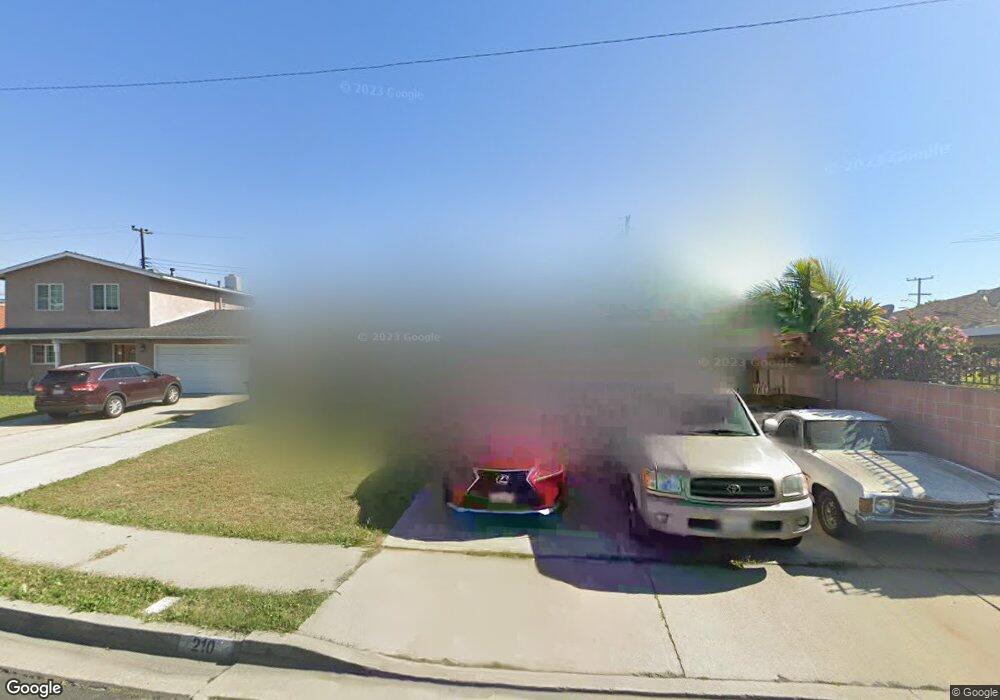
210 E 212th St Carson, CA 90745
Estimated Value: $771,374 - $867,000
3
Beds
2
Baths
1,537
Sq Ft
$534/Sq Ft
Est. Value
About This Home
This home is located at 210 E 212th St, Carson, CA 90745 and is currently estimated at $820,594, approximately $533 per square foot. 210 E 212th St is a home located in Los Angeles County with nearby schools including Carson Street Elementary School, Stephen M. White Middle School, and Academies Of Education And Empowerment.
Ownership History
Date
Name
Owned For
Owner Type
Purchase Details
Closed on
Sep 2, 2003
Sold by
Mccright Marc
Bought by
Mccright Marc and Mccright Shirley
Current Estimated Value
Home Financials for this Owner
Home Financials are based on the most recent Mortgage that was taken out on this home.
Original Mortgage
$165,000
Interest Rate
6.06%
Mortgage Type
Purchase Money Mortgage
Purchase Details
Closed on
Mar 14, 1997
Sold by
Federal Home Loan Mortgage Corporation
Bought by
Mccright Marc
Home Financials for this Owner
Home Financials are based on the most recent Mortgage that was taken out on this home.
Original Mortgage
$149,350
Interest Rate
7.74%
Mortgage Type
VA
Purchase Details
Closed on
Nov 20, 1996
Sold by
Pablo Rolando and Federal Home Loan Mortgage Cor
Bought by
Federal Home Loan Mortgage Corporation
Create a Home Valuation Report for This Property
The Home Valuation Report is an in-depth analysis detailing your home's value as well as a comparison with similar homes in the area
Home Values in the Area
Average Home Value in this Area
Purchase History
| Date | Buyer | Sale Price | Title Company |
|---|---|---|---|
| Mccright Marc | -- | United Title Company | |
| Mccright Marc | $145,000 | First American Title | |
| Federal Home Loan Mortgage Corporation | $145,000 | American Title Company |
Source: Public Records
Mortgage History
| Date | Status | Borrower | Loan Amount |
|---|---|---|---|
| Closed | Mccright Marc | $165,000 | |
| Closed | Mccright Marc | $149,350 |
Source: Public Records
Tax History
| Year | Tax Paid | Tax Assessment Tax Assessment Total Assessment is a certain percentage of the fair market value that is determined by local assessors to be the total taxable value of land and additions on the property. | Land | Improvement |
|---|---|---|---|---|
| 2025 | $3,708 | $236,128 | $123,112 | $113,016 |
| 2024 | $3,708 | $231,499 | $120,699 | $110,800 |
| 2023 | $3,633 | $226,961 | $118,333 | $108,628 |
| 2022 | $3,462 | $222,512 | $116,013 | $106,499 |
| 2021 | $3,415 | $218,150 | $113,739 | $104,411 |
| 2019 | $3,286 | $211,681 | $110,366 | $101,315 |
| 2018 | $3,179 | $207,531 | $108,202 | $99,329 |
| 2017 | $3,121 | $203,463 | $106,081 | $97,382 |
| 2016 | $3,041 | $199,474 | $104,001 | $95,473 |
| 2015 | $2,976 | $196,478 | $102,439 | $94,039 |
| 2014 | $2,969 | $192,630 | $100,433 | $92,197 |
Source: Public Records
Map
Nearby Homes
- 21328 Orrick Ave
- 21111 Dolores St Unit 12
- 21111 Dolores St
- 21111 Dolores St Unit 54
- 21403 Catskill Ave
- 149 E 211th St
- 21610 Orrick Ave Unit 7
- 21103 Shearer Ave
- 21314 Kinard Ave
- 21719 Neptune Ave
- 127 W 219th Place
- 421 E 219th St
- 21826 Ravenna Ave
- 21730 Grace Ave Unit 2
- 416 E 219th St
- 518 W 213th St
- 429 Willow Run Ln
- 21425 S Avalon Blvd Unit 22
- 22031 Main St Unit 1
- 21602 S Figueroa St
- 214 E 212th St
- 21212 Bolsa St
- 204 E 212th St
- 211 E Clarion Dr
- 215 E Clarion Dr
- 21218 Bolsa St
- 220 E 212th St
- 205 E 212th St
- 211 E 212th St
- 205 E Clarion Dr
- 221 E Clarion Dr
- 222 E 212th St
- 215 E 212th St
- 21140 Bolsa St
- 223 E 212th St
- 221 E 212th St
- 223 E Clarion Dr
- 21232 Bolsa St
- 21134 Bolsa St
- 21211 Bolsa St
Your Personal Tour Guide
Ask me questions while you tour the home.