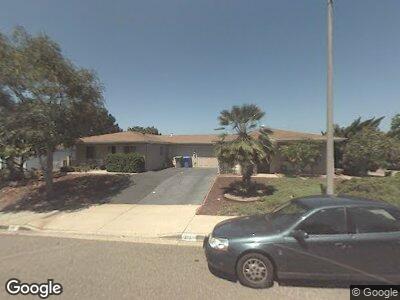
210 Fraxinella St Encinitas, CA 92024
Estimated Value: $802,482 - $1,196,000
2
Beds
1
Bath
1,100
Sq Ft
$839/Sq Ft
Est. Value
About This Home
This home is located at 210 Fraxinella St, Encinitas, CA 92024 and is currently estimated at $922,871, approximately $838 per square foot. 210 Fraxinella St is a home located in San Diego County with nearby schools including Park Dale Lane Elementary, Oak Crest Middle School, and La Costa Canyon High School.
Ownership History
Date
Name
Owned For
Owner Type
Purchase Details
Closed on
May 26, 2012
Sold by
Fu Samuel and Fu Glenice
Bought by
Fu Samuel and Fu Glenice Tobiano
Current Estimated Value
Purchase Details
Closed on
Jan 17, 2012
Sold by
Fu Samuel
Bought by
Fu Samuel and Fu Glenice
Home Financials for this Owner
Home Financials are based on the most recent Mortgage that was taken out on this home.
Original Mortgage
$267,000
Interest Rate
3.93%
Mortgage Type
New Conventional
Purchase Details
Closed on
May 14, 2010
Sold by
Fu Samuel
Bought by
Fu Samuel
Purchase Details
Closed on
Dec 7, 1998
Sold by
Cummins Marjorie A
Bought by
Fu Samuel
Home Financials for this Owner
Home Financials are based on the most recent Mortgage that was taken out on this home.
Original Mortgage
$126,400
Interest Rate
6.63%
Create a Home Valuation Report for This Property
The Home Valuation Report is an in-depth analysis detailing your home's value as well as a comparison with similar homes in the area
Home Values in the Area
Average Home Value in this Area
Purchase History
| Date | Buyer | Sale Price | Title Company |
|---|---|---|---|
| Fu Samuel | -- | First American Title | |
| Fu Samuel | -- | First American Title Company | |
| Fu Samuel | -- | None Available | |
| Fu Samuel | $160,000 | First American Title |
Source: Public Records
Mortgage History
| Date | Status | Borrower | Loan Amount |
|---|---|---|---|
| Open | Fu Samuel | $210,000 | |
| Closed | Fu Samuel | $267,000 | |
| Closed | Fu Samuel | $126,400 |
Source: Public Records
Tax History Compared to Growth
Tax History
| Year | Tax Paid | Tax Assessment Tax Assessment Total Assessment is a certain percentage of the fair market value that is determined by local assessors to be the total taxable value of land and additions on the property. | Land | Improvement |
|---|---|---|---|---|
| 2024 | $2,833 | $242,820 | $153,688 | $89,132 |
| 2023 | $2,773 | $238,060 | $150,675 | $87,385 |
| 2022 | $2,705 | $233,393 | $147,721 | $85,672 |
| 2021 | $2,659 | $228,818 | $144,825 | $83,993 |
| 2020 | $2,662 | $226,472 | $143,340 | $83,132 |
| 2019 | $2,611 | $222,032 | $140,530 | $81,502 |
| 2018 | $2,589 | $217,679 | $137,775 | $79,904 |
| 2017 | $2,548 | $213,412 | $135,074 | $78,338 |
| 2016 | $2,464 | $209,228 | $132,426 | $76,802 |
| 2015 | $2,436 | $206,086 | $130,437 | $75,649 |
| 2014 | $2,468 | $202,050 | $127,882 | $74,168 |
Source: Public Records
Map
Nearby Homes
- 155 Rosebay Dr Unit 31
- 820 Encinitas Blvd Unit 203
- 820 Encinitas Blvd Unit 103
- 0 Mays Hollow Ln
- 1164 Quail Gardens Ct
- 557 Samuel Ct
- 571 Lynwood Dr
- 263 Via Villena
- 656 Westlake St
- 444 N El Camino Real Unit 2
- 623 Quail Gardens Ln
- 502 Quail Gardens Dr
- 647 Manzanita Ln
- 722 Piedras Oro Calle Unit 6
- 939 Avenida de San Clemente
- 1203 Cambria Way
- 540 Nobel Ct
- 836 Jensen Ct
- 812 Regal Rd Unit P6
- 802 Regal Rd Unit 4M
- 210 Fraxinella St
- 212 Fraxinella St
- 206 Fraxinella St
- 208 Fraxinella St
- 209 Rosebay Dr
- 201 Rosebay Dr
- 203 Rosebay Dr
- 207 Rosebay Dr
- 216 Fraxinella St
- 218 Fraxinella St
- 209 Fraxinella St
- 211 Fraxinella St
- 204 Fraxinella St
- 207 Fraxinella St
- 197 Rosebay Dr
- 219 Rosebay Dr
- 221 Rosebay Dr
- 215 Fraxinella St
- 217 Fraxinella St
- 195 Rosebay Dr