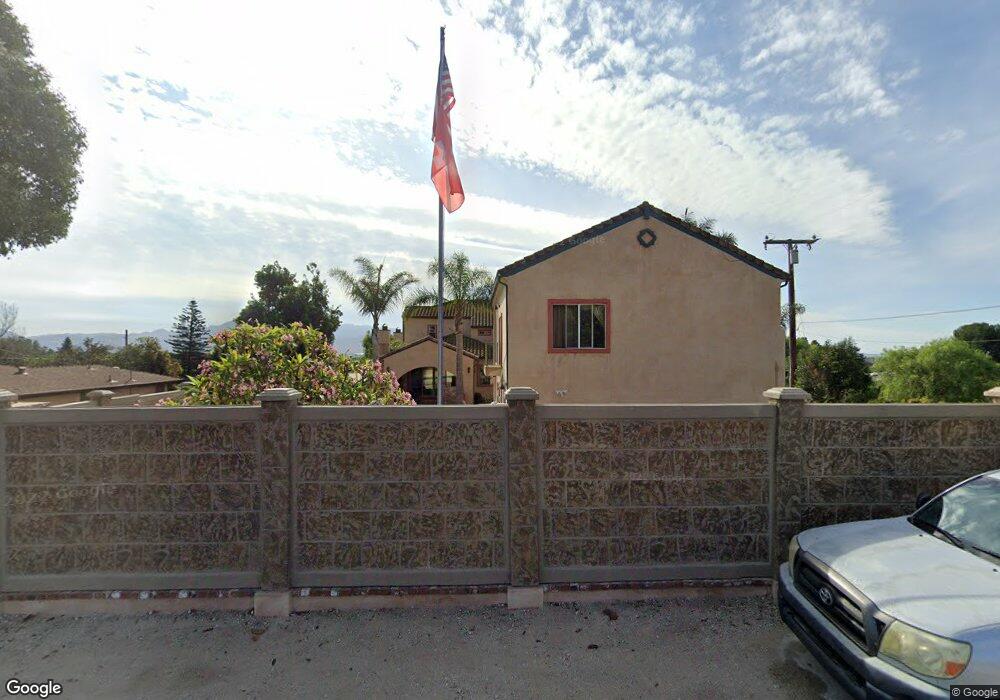
210 Mesa Dr Camarillo, CA 93010
Estimated Value: $1,256,000 - $1,767,531
4
Beds
4
Baths
4,374
Sq Ft
$327/Sq Ft
Est. Value
About This Home
This home is located at 210 Mesa Dr, Camarillo, CA 93010 and is currently estimated at $1,430,383, approximately $327 per square foot. 210 Mesa Dr is a home located in Ventura County with nearby schools including Camarillo Heights Elementary School, Monte Vista Middle School, and Adolfo Camarillo High School.
Ownership History
Date
Name
Owned For
Owner Type
Purchase Details
Closed on
May 20, 1999
Sold by
Anderson Tack K
Bought by
Anderson Christine M
Current Estimated Value
Home Financials for this Owner
Home Financials are based on the most recent Mortgage that was taken out on this home.
Original Mortgage
$279,000
Outstanding Balance
$48,418
Interest Rate
2.9%
Estimated Equity
$1,381,965
Purchase Details
Closed on
Oct 17, 1997
Sold by
Marietta Martin J
Bought by
Mcmullen Daniel A
Home Financials for this Owner
Home Financials are based on the most recent Mortgage that was taken out on this home.
Original Mortgage
$184,000
Interest Rate
7.62%
Purchase Details
Closed on
Oct 6, 1997
Sold by
Marietta Kelly Diane
Bought by
Marietta Martin J
Home Financials for this Owner
Home Financials are based on the most recent Mortgage that was taken out on this home.
Original Mortgage
$184,000
Interest Rate
7.62%
Create a Home Valuation Report for This Property
The Home Valuation Report is an in-depth analysis detailing your home's value as well as a comparison with similar homes in the area
Home Values in the Area
Average Home Value in this Area
Purchase History
| Date | Buyer | Sale Price | Title Company |
|---|---|---|---|
| Anderson Christine M | -- | First American Title Ins Co | |
| Anderson Christine M | $310,000 | First American Title Ins Co | |
| Mcmullen Daniel A | $230,000 | First American Title Co | |
| Marietta Martin J | -- | First American Title Co | |
| Marietta Martin J | $220,000 | First American Title Co |
Source: Public Records
Mortgage History
| Date | Status | Borrower | Loan Amount |
|---|---|---|---|
| Open | Anderson Christine M | $279,000 | |
| Previous Owner | Mcmullen Daniel A | $184,000 |
Source: Public Records
Tax History
| Year | Tax Paid | Tax Assessment Tax Assessment Total Assessment is a certain percentage of the fair market value that is determined by local assessors to be the total taxable value of land and additions on the property. | Land | Improvement |
|---|---|---|---|---|
| 2025 | $15,715 | $1,447,254 | $391,918 | $1,055,336 |
| 2024 | $15,715 | $1,418,877 | $384,233 | $1,034,644 |
| 2023 | $14,487 | $1,330,256 | $376,699 | $953,557 |
| 2022 | $14,445 | $1,304,173 | $369,313 | $934,860 |
| 2021 | $13,923 | $1,278,601 | $362,071 | $916,530 |
| 2020 | $13,874 | $1,265,492 | $358,359 | $907,133 |
| 2019 | $13,811 | $1,240,680 | $351,333 | $889,347 |
| 2018 | $13,557 | $1,216,354 | $344,445 | $871,909 |
| 2017 | $12,753 | $1,192,505 | $337,692 | $854,813 |
| 2016 | $12,446 | $1,169,123 | $331,071 | $838,052 |
| 2015 | $12,314 | $1,151,563 | $326,099 | $825,464 |
| 2014 | $12,025 | $1,129,008 | $319,712 | $809,296 |
Source: Public Records
Map
Nearby Homes
- 928 Mission Dr
- 2496 Parkway Dr
- 567 Mesa Dr
- 542 San Clemente Way
- 2251 Camilar Dr
- 2086 El Rancho Dr
- 520 E Highland Dr
- 999 San Clemente Way
- 67 Santa Cruz Way
- 2228 Camilar Dr
- 2274 Via Tomas
- 131 San Miguel Dr
- 894 W Highland Dr
- 244 W Highland Dr
- 2103 Euclid Ave
- 375 W Highland Dr
- 702 W Highland Dr
- 1709 Las Posas Rd
- 1820 Temple Ave
- 2436 Kimberly Ave
- 168 Mesa Dr
- 240 Mesa Dr
- 364 Mesa Dr
- 1 Marissa Ln
- 0 Marissa Ln Unit 80021664
- 0 Marissa Ln Unit 90017647
- 0 Marissa Ln Unit 80007426
- 0 Marissa Ln Unit 80016935
- 0 Marissa Ln Unit 90000594
- Lot Marissa Ln
- 0 Marissa Ln Unit V0-80007426
- 0 Marissa Ln Unit V0-80016935
- 0 Marissa Ln Unit V0-90017647
- 0 Marissa Ln Unit V0-11001221
- 0 Marissa Ln Unit 214014834
- 0 Marissa Ln Unit 214033453
- 0 Marissa Ln Unit V0-80021664
- 0 Marissa Ln Unit V0-90000594
- 0 Marissa Ln Unit V0-12006485
- 0 Marissa Ln Unit V0-10010194
Your Personal Tour Guide
Ask me questions while you tour the home.