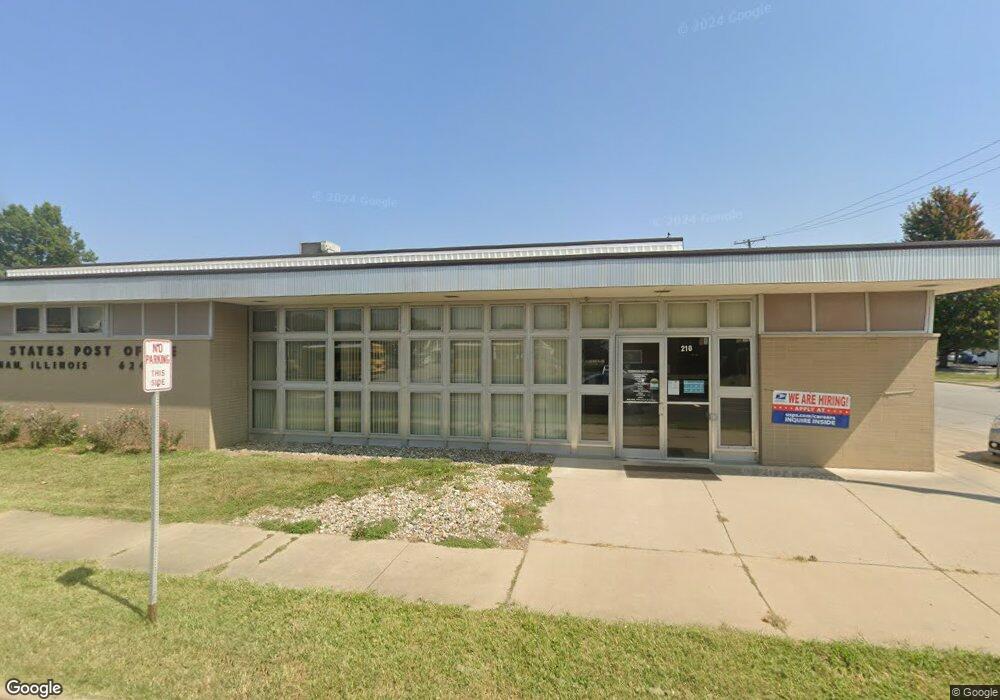
210 N 3rd St Effingham, IL 62401
Estimated Value: $184,000 - $1,436,415
Studio
--
Bath
14,508
Sq Ft
$56/Sq Ft
Est. Value
About This Home
This home is located at 210 N 3rd St, Effingham, IL 62401 and is currently estimated at $810,208, approximately $55 per square foot. 210 N 3rd St is a home with nearby schools including South Side Grade School, Early Learning Center, and Central Grade School.
Create a Home Valuation Report for This Property
The Home Valuation Report is an in-depth analysis detailing your home's value as well as a comparison with similar homes in the area
Home Values in the Area
Average Home Value in this Area
Tax History
| Year | Tax Paid | Tax Assessment Tax Assessment Total Assessment is a certain percentage of the fair market value that is determined by local assessors to be the total taxable value of land and additions on the property. | Land | Improvement |
|---|---|---|---|---|
| 2024 | $25,119 | $371,820 | $62,760 | $309,060 |
| 2023 | $23,013 | $338,010 | $57,050 | $280,960 |
| 2022 | $21,597 | $310,100 | $52,340 | $257,760 |
| 2021 | $22,269 | $307,030 | $51,820 | $255,210 |
| 2020 | $21,867 | $298,380 | $50,360 | $248,020 |
| 2019 | $21,453 | $295,420 | $49,860 | $245,560 |
| 2018 | $20,758 | $284,060 | $47,940 | $236,120 |
| 2017 | $20,403 | $278,490 | $47,000 | $231,490 |
| 2016 | $19,975 | $270,380 | $45,630 | $224,750 |
| 2015 | -- | $262,500 | $44,300 | $218,200 |
| 2014 | -- | $254,850 | $43,010 | $211,840 |
| 2013 | -- | $249,860 | $42,170 | $207,690 |
| 2012 | -- | $246,170 | $41,550 | $204,620 |
Source: Public Records
Map
Nearby Homes
- 104 S Willow St
- 507 E Jefferson Ave
- 302 N Main St
- 801 N Cleveland St
- 406 W Kentucky Ave
- 602 S 5th St
- 401 S Walnut St
- 109 N Lincoln St
- 806 S 4th St
- 403 Eden Dr
- 702 W Fayette Ave
- 906 S 3rd St
- 203 S Mulberry St
- 710 W Richland Ave
- 602 S Linden St
- 1005 S 3rd St
- 901 & 903 W Saint Louis Ave
- 921 Lynn Dr
- 306 W Wabash Ave
- 1105 N Merchant St
Your Personal Tour Guide
Ask me questions while you tour the home.