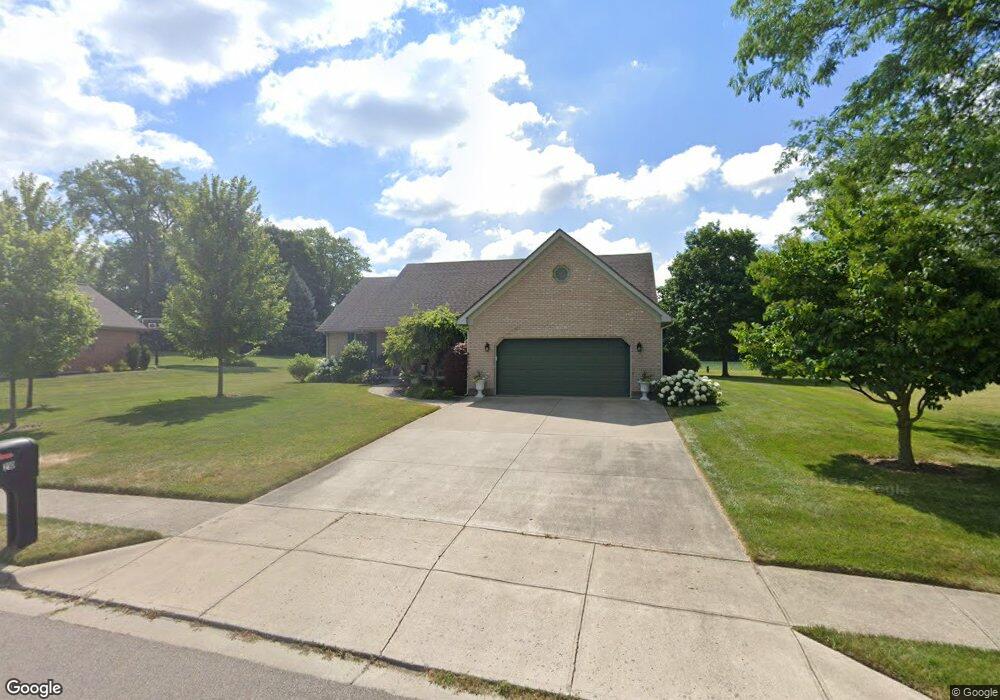
210 S Wenrick St Covington, OH 45318
Estimated Value: $257,062 - $380,000
3
Beds
2
Baths
1,792
Sq Ft
$179/Sq Ft
Est. Value
About This Home
This home is located at 210 S Wenrick St, Covington, OH 45318 and is currently estimated at $320,516, approximately $178 per square foot. 210 S Wenrick St is a home located in Miami County with nearby schools including Covington Elementary/Junior High School, Covington Junior High School, and Covington High School.
Ownership History
Date
Name
Owned For
Owner Type
Purchase Details
Closed on
Oct 30, 2018
Sold by
Angle Darlene M
Bought by
Angle Chad A and Darlene M Angle Irrevocable Tr
Current Estimated Value
Purchase Details
Closed on
Jul 1, 2016
Sold by
Miller Bernice
Bought by
Angle Darlene M
Home Financials for this Owner
Home Financials are based on the most recent Mortgage that was taken out on this home.
Original Mortgage
$135,850
Outstanding Balance
$106,971
Interest Rate
3.66%
Mortgage Type
New Conventional
Estimated Equity
$213,545
Purchase Details
Closed on
Oct 23, 2003
Sold by
Ganger Candy J and Ganger Crystal R
Bought by
Miller Berice and Glen E Miller Revocable Trust
Purchase Details
Closed on
May 22, 2003
Sold by
Minnich Betty J
Bought by
Ganger Candy J and Ganger Crystal R
Purchase Details
Closed on
Apr 3, 2001
Sold by
Burgess Marilyn Inez
Bought by
Minnich Betty
Purchase Details
Closed on
Jan 1, 1990
Bought by
New Tech Plastics Inc
Create a Home Valuation Report for This Property
The Home Valuation Report is an in-depth analysis detailing your home's value as well as a comparison with similar homes in the area
Home Values in the Area
Average Home Value in this Area
Purchase History
| Date | Buyer | Sale Price | Title Company |
|---|---|---|---|
| Angle Chad A | -- | None Available | |
| Angle Darlene M | $143,000 | Hallmark Title | |
| Miller Berice | $155,000 | -- | |
| Ganger Candy J | -- | -- | |
| Minnich Betty | $155,000 | -- | |
| New Tech Plastics Inc | -- | -- |
Source: Public Records
Mortgage History
| Date | Status | Borrower | Loan Amount |
|---|---|---|---|
| Open | Angle Darlene M | $135,850 |
Source: Public Records
Tax History
| Year | Tax Paid | Tax Assessment Tax Assessment Total Assessment is a certain percentage of the fair market value that is determined by local assessors to be the total taxable value of land and additions on the property. | Land | Improvement |
|---|---|---|---|---|
| 2025 | $3,329 | $102,000 | $15,230 | $86,770 |
| 2024 | $3,329 | $64,130 | $12,710 | $51,420 |
| 2023 | $2,402 | $64,130 | $12,710 | $51,420 |
| 2022 | $2,396 | $64,130 | $12,710 | $51,420 |
| 2021 | $2,587 | $64,130 | $12,710 | $51,420 |
| 2020 | $2,592 | $64,130 | $12,710 | $51,420 |
| 2019 | $2,604 | $64,130 | $12,710 | $51,420 |
| 2018 | $2,206 | $54,220 | $13,720 | $40,500 |
| 2017 | $2,245 | $54,220 | $13,720 | $40,500 |
| 2016 | $2,216 | $54,220 | $13,720 | $40,500 |
| 2015 | $1,966 | $50,200 | $12,710 | $37,490 |
| 2014 | $1,966 | $50,200 | $12,710 | $37,490 |
| 2013 | $1,893 | $50,200 | $12,710 | $37,490 |
Source: Public Records
Map
Nearby Homes
- 206 S Wenrick St
- 214 S Wenrick St
- 205 S Wenrick St
- 218 S Wenrick St
- 202 S Wenrick St
- 505 E Bridge St
- 209 S Wenrick St
- 501 E Bridge St
- 605 E Bridge St
- 213 S Wenrick St
- 20 Brookston Ct
- 136 S Wenrick St
- 141 S Wenrick St
- 604 E Bridge St
- 407 E Bridge St
- 134 S Ludlow St
- 607 E Bridge St
- 113 Crosby St
- 15 Brookston Ct
- 606 E Bridge St
Your Personal Tour Guide
Ask me questions while you tour the home.