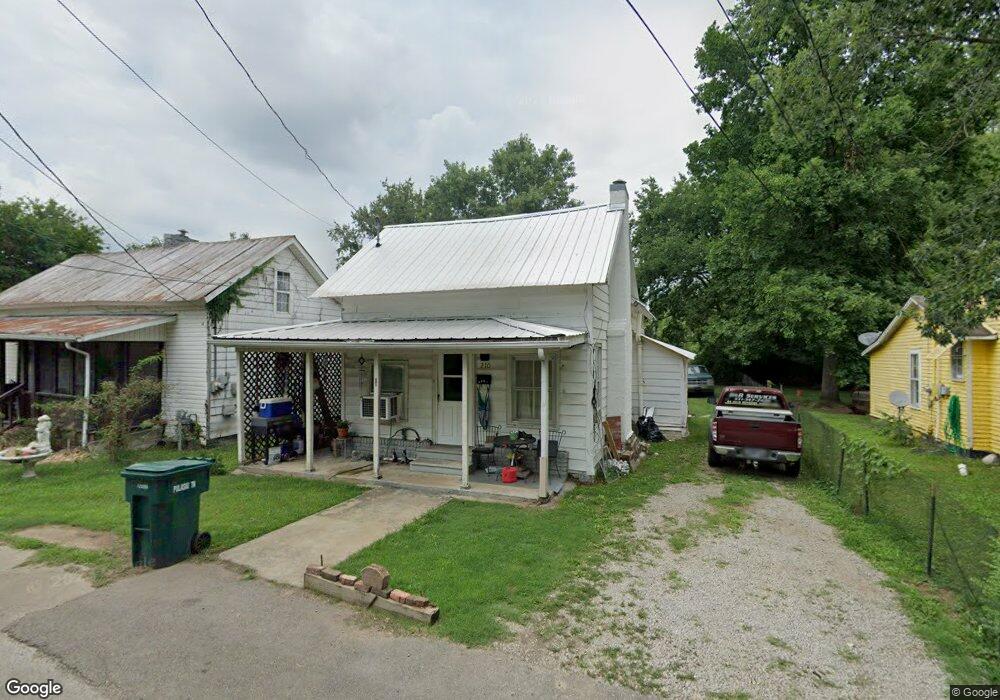
210 Turner St Pulaski, TN 38478
Estimated Value: $84,000 - $160,000
3
Beds
2
Baths
1,310
Sq Ft
$82/Sq Ft
Est. Value
About This Home
This home is located at 210 Turner St, Pulaski, TN 38478 and is currently estimated at $107,998, approximately $82 per square foot. 210 Turner St is a home located in Giles County with nearby schools including Pulaski Elementary School, Southside Elementary School, and Bridgeforth Middle School.
Ownership History
Date
Name
Owned For
Owner Type
Purchase Details
Closed on
Jul 27, 2022
Sold by
Wallace Sorrow Karen
Bought by
Foxwood Properties Llc
Current Estimated Value
Purchase Details
Closed on
Dec 11, 2012
Sold by
Wallace Thomas C
Bought by
Sorrow Karen Wallace
Purchase Details
Closed on
Mar 22, 2010
Sold by
Federal National Mortgage Association
Bought by
Wallace Tom
Purchase Details
Closed on
Aug 13, 2009
Sold by
Burke Heather M
Bought by
Federal National Mtg Associati
Purchase Details
Closed on
Sep 18, 2007
Sold by
Dale David W
Bought by
Burke Heather
Purchase Details
Closed on
Aug 6, 1997
Sold by
Williams Albert
Bought by
Dale David W
Purchase Details
Closed on
Mar 7, 1997
Sold by
Williams Robert A
Bought by
Williams Albert
Purchase Details
Closed on
Aug 2, 1993
Bought by
Williams Robert A
Purchase Details
Closed on
Oct 26, 1979
Bought by
Lewellyn Anthonys and Lewellyn Geneva
Create a Home Valuation Report for This Property
The Home Valuation Report is an in-depth analysis detailing your home's value as well as a comparison with similar homes in the area
Home Values in the Area
Average Home Value in this Area
Purchase History
| Date | Buyer | Sale Price | Title Company |
|---|---|---|---|
| Foxwood Properties Llc | $69,000 | Andrew Hoover & Attorneys Pc | |
| Sorrow Karen Wallace | -- | -- | |
| Wallace Tom | $5,000 | -- | |
| Federal National Mtg Associati | -- | -- | |
| Burke Heather | $44,123 | -- | |
| Dale David W | $21,500 | -- | |
| Williams Albert | $6,000 | -- | |
| Williams Robert A | -- | -- | |
| Lewellyn Anthonys | -- | -- |
Source: Public Records
Tax History
| Year | Tax Paid | Tax Assessment Tax Assessment Total Assessment is a certain percentage of the fair market value that is determined by local assessors to be the total taxable value of land and additions on the property. | Land | Improvement |
|---|---|---|---|---|
| 2025 | $416 | $15,275 | $1,175 | $14,100 |
| 2024 | $367 | $15,275 | $1,175 | $14,100 |
| 2023 | $367 | $15,275 | $1,175 | $14,100 |
| 2022 | $367 | $15,275 | $1,175 | $14,100 |
| 2021 | $282 | $8,325 | $625 | $7,700 |
| 2020 | $282 | $8,325 | $625 | $7,700 |
| 2019 | $235 | $8,325 | $625 | $7,700 |
| 2018 | $282 | $8,325 | $625 | $7,700 |
| 2017 | $282 | $8,325 | $625 | $7,700 |
| 2016 | $246 | $6,950 | $625 | $6,325 |
| 2015 | $232 | $6,950 | $625 | $6,325 |
| 2014 | -- | $6,955 | $0 | $0 |
Source: Public Records
Map
Nearby Homes
- 418 Jones St
- 424 Jones St
- 122 Fiddlers Ct
- 320 Park St
- 350 N 3rd St
- 308 W Woodring St
- 613 Mcgrew St
- 321 W Washington St
- 0 Sumpter St
- 808 N 1st St
- 630 Marietta St
- 318 W Jefferson St
- 339 W Washington St
- 550 E Jefferson St
- 300 Morris St
- 544 E Madison St
- 207 N Cedar Ln
- 527 E Madison St
- 311 S 1st St
- 420 Fort Hill Dr
Your Personal Tour Guide
Ask me questions while you tour the home.