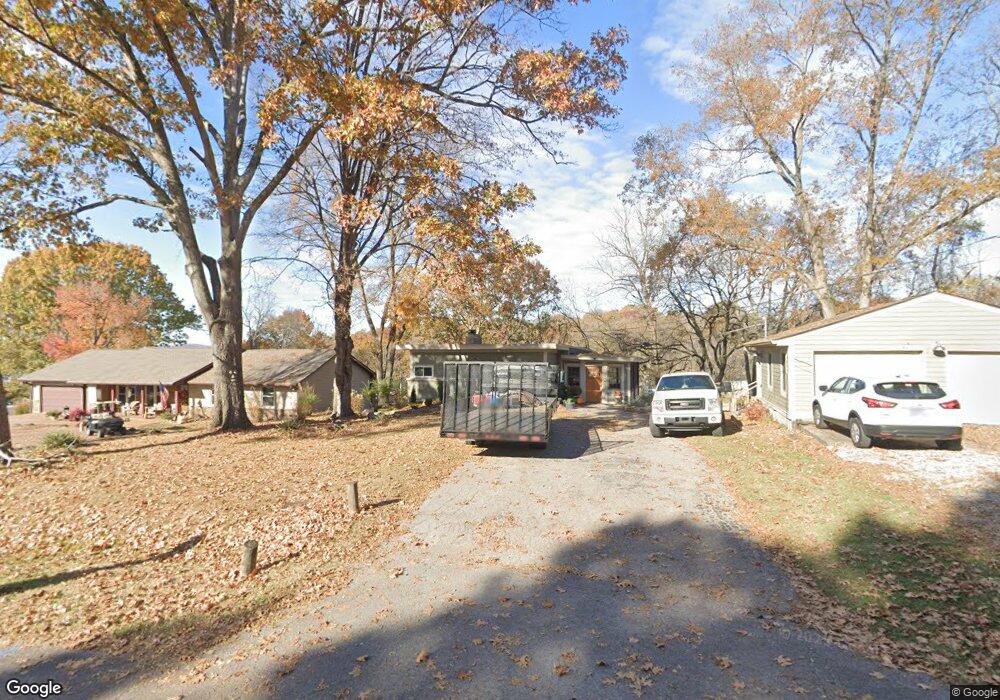
210 W Lakeview Dr Mount Juliet, TN 37122
Estimated Value: $278,758 - $624,000
--
Bed
2
Baths
1,107
Sq Ft
$423/Sq Ft
Est. Value
About This Home
This home is located at 210 W Lakeview Dr, Mount Juliet, TN 37122 and is currently estimated at $467,940, approximately $422 per square foot. 210 W Lakeview Dr is a home located in Wilson County with nearby schools including Lakeview Elementary School, Mt. Juliet Middle School, and Green Hill High School.
Ownership History
Date
Name
Owned For
Owner Type
Purchase Details
Closed on
Mar 19, 2018
Sold by
Cddhomes4tn Llc
Bought by
Curtis Lee Hopper Revocable Trust and Hopper Curtis Lee
Current Estimated Value
Purchase Details
Closed on
May 11, 2017
Sold by
Hopper Curtis L
Bought by
Cddhomes 84Th Llc
Purchase Details
Closed on
Apr 17, 2017
Sold by
Holland Tina Hopper
Bought by
Hopper Curtis L
Purchase Details
Closed on
May 31, 2007
Sold by
Gann David C
Bought by
Hopper Curtis L
Home Financials for this Owner
Home Financials are based on the most recent Mortgage that was taken out on this home.
Original Mortgage
$150,000
Interest Rate
6.12%
Purchase Details
Closed on
Oct 2, 1998
Sold by
Ronald Clemmons
Bought by
Gann David C and Marie Ann
Purchase Details
Closed on
Sep 30, 1998
Sold by
Gann David C
Bought by
Gann David C and Gann Ann M
Purchase Details
Closed on
Aug 19, 1977
Bought by
Clemmons Ronald
Create a Home Valuation Report for This Property
The Home Valuation Report is an in-depth analysis detailing your home's value as well as a comparison with similar homes in the area
Home Values in the Area
Average Home Value in this Area
Purchase History
| Date | Buyer | Sale Price | Title Company |
|---|---|---|---|
| Curtis Lee Hopper Revocable Trust | -- | None Available | |
| Cddhomes 84Th Llc | -- | Birthright Title Llc | |
| Hopper Curtis L | -- | Birthright Title Llc | |
| Hopper Curtis L | $250,000 | -- | |
| Gann David C | $165,000 | -- | |
| Gann David C | $165,000 | -- | |
| Clemmons Ronald | -- | -- |
Source: Public Records
Mortgage History
| Date | Status | Borrower | Loan Amount |
|---|---|---|---|
| Open | Clemmons Ronald | $155,500 | |
| Previous Owner | Clemmons Ronald | $150,000 |
Source: Public Records
Tax History Compared to Growth
Tax History
| Year | Tax Paid | Tax Assessment Tax Assessment Total Assessment is a certain percentage of the fair market value that is determined by local assessors to be the total taxable value of land and additions on the property. | Land | Improvement |
|---|---|---|---|---|
| 2024 | $1,163 | $60,950 | $22,500 | $38,450 |
| 2022 | $1,163 | $60,950 | $22,500 | $38,450 |
| 2021 | $1,163 | $60,950 | $22,500 | $38,450 |
| 2020 | $1,222 | $60,950 | $22,500 | $38,450 |
| 2019 | $1,222 | $48,500 | $20,625 | $27,875 |
| 2018 | $1,222 | $48,500 | $20,625 | $27,875 |
| 2017 | $1,222 | $48,500 | $20,625 | $27,875 |
| 2016 | $1,222 | $48,500 | $20,625 | $27,875 |
| 2015 | $1,247 | $48,500 | $20,625 | $27,875 |
| 2014 | $1,021 | $39,735 | $0 | $0 |
Source: Public Records
Map
Nearby Homes
- 14 Lake Forest Dr
- 1010 Noel Dr
- 1009 Mystic Streams Dr
- 300 Dani Ct
- 206 James Matthew Ln
- 37 Kebu Rd
- 2237 Saundersville Ferry Rd
- 333 Burris Rd
- 1896 Saundersville Ferry Rd
- 3904 Saundersville Ferry Rd
- 310 Weeping Elm Rd
- 4245 Nonaville Rd
- 425 Beth Dr
- 316 River Dr
- 220 Waterview Dr
- 740 Lakeview Cir
- 118B Moonlight Dr
- 541 Lakeview Cir
- 542 Cumberland Hills Dr
- 1012 Broughton Place
- 220 W Lakeview Dr
- 190 W Lakeview Dr
- 2853 Lakeside Ct
- 180 W Lakeview Dr
- 700 Lakeside Ct
- 698 Lakeside Ct
- 165 W Lakeview Dr
- 165 W Lakeview Dr
- 165 W Lakeview Dr
- 165 W Lakeview Dr
- 135 W Lakeview Dr
- 555 Crosswinds Dr
- 535 Crosswinds Dr
- 29 Carter Ln
- 49 Carter Ln
- 515 Crosswinds Dr
- 69 Carter Ln
- 80 W Lakeview Dr
- 475 Crosswinds Dr
- 575 Crosswinds Dr