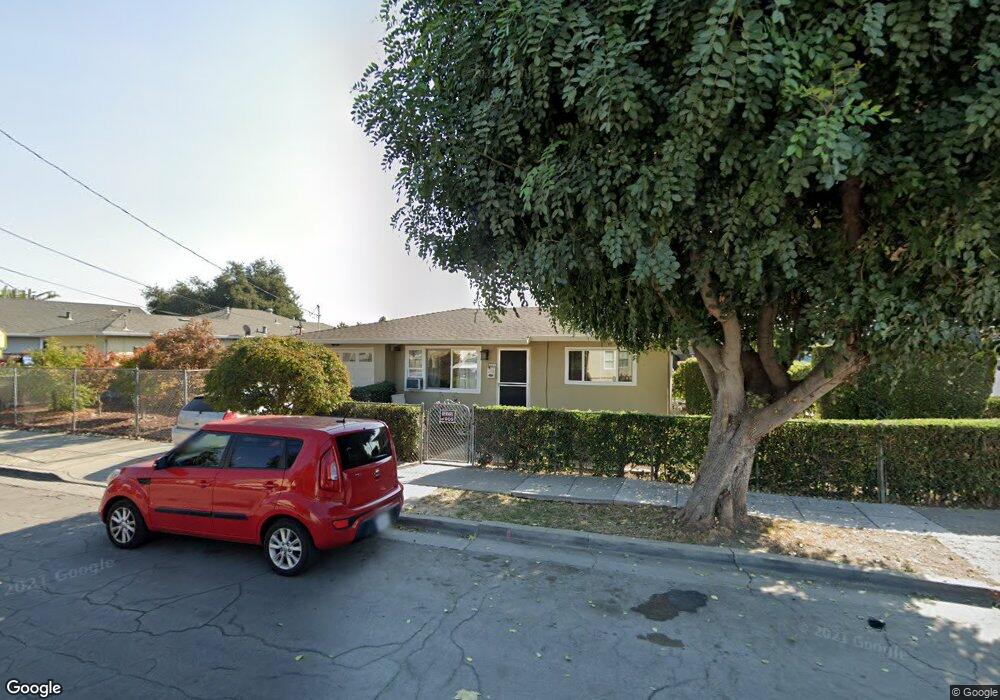
210 Wabash Ave San Jose, CA 95128
Rose Garden NeighborhoodEstimated Value: $836,000 - $1,374,000
2
Beds
1
Bath
764
Sq Ft
$1,454/Sq Ft
Est. Value
About This Home
This home is located at 210 Wabash Ave, San Jose, CA 95128 and is currently estimated at $1,111,199, approximately $1,454 per square foot. 210 Wabash Ave is a home located in Santa Clara County with nearby schools including Merritt Trace Elementary, Herbert Hoover Middle School, and Abraham Lincoln High.
Ownership History
Date
Name
Owned For
Owner Type
Purchase Details
Closed on
Jan 26, 2005
Sold by
Yamamoto Deanna
Bought by
Yamamoto Deanna
Current Estimated Value
Purchase Details
Closed on
Jun 11, 2003
Sold by
Walker Donald S and Walker Debbie
Bought by
Yamamoto Wayne T and Yamamoto Deanna
Purchase Details
Closed on
Jun 9, 2003
Sold by
Sanchez Leonard M and Sanchez Bonnie L
Bought by
Yamamoto Wayne T and Yamamoto Deanna
Purchase Details
Closed on
Apr 7, 2003
Sold by
Sanchez Robert D
Bought by
Walker Donald S and Walker Debbie
Purchase Details
Closed on
Sep 17, 2002
Sold by
Sanchez Robert D
Bought by
Sanchez Robert D
Purchase Details
Closed on
Jun 25, 2002
Sold by
Sanchez Leonard
Bought by
Sanchez Leonard M and Sanchez Bonnie L
Purchase Details
Closed on
Jan 28, 2002
Sold by
Walker Debbie
Bought by
Walker Donald S and Walker Debbie
Purchase Details
Closed on
Jan 24, 2002
Sold by
Yamamoto Deanna
Bought by
Yamamoto Wayne T and Yamamoto Deanna
Purchase Details
Closed on
Feb 21, 2001
Sold by
Sanchez Robert D and Sanchez Gilbert A
Bought by
Yamamoto Deanna and Walker Debbie
Create a Home Valuation Report for This Property
The Home Valuation Report is an in-depth analysis detailing your home's value as well as a comparison with similar homes in the area
Home Values in the Area
Average Home Value in this Area
Purchase History
| Date | Buyer | Sale Price | Title Company |
|---|---|---|---|
| Yamamoto Deanna | -- | -- | |
| Yamamoto Wayne T | $170,000 | Alliance Title Company | |
| Yamamoto Wayne T | $170,000 | Alliance Title Company | |
| Walker Donald S | $257,000 | Alliance Title Company | |
| Sanchez Robert D | -- | -- | |
| Sanchez Leonard M | -- | -- | |
| Walker Donald S | -- | -- | |
| Yamamoto Wayne T | -- | -- | |
| Yamamoto Deanna | -- | -- |
Source: Public Records
Tax History
| Year | Tax Paid | Tax Assessment Tax Assessment Total Assessment is a certain percentage of the fair market value that is determined by local assessors to be the total taxable value of land and additions on the property. | Land | Improvement |
|---|---|---|---|---|
| 2025 | $5,630 | $351,761 | $277,611 | $74,150 |
| 2024 | $5,630 | $344,865 | $272,168 | $72,697 |
| 2023 | $5,492 | $338,104 | $266,832 | $71,272 |
| 2022 | $5,434 | $331,475 | $261,600 | $69,875 |
| 2021 | $5,278 | $324,976 | $256,471 | $68,505 |
| 2020 | $5,126 | $321,645 | $253,842 | $67,803 |
| 2019 | $4,937 | $315,339 | $248,865 | $66,474 |
| 2018 | $4,872 | $309,157 | $243,986 | $65,171 |
| 2017 | $4,822 | $303,096 | $239,202 | $63,894 |
| 2016 | $4,672 | $297,154 | $234,512 | $62,642 |
| 2015 | $4,631 | $292,692 | $230,990 | $61,702 |
| 2014 | $4,204 | $286,960 | $226,466 | $60,494 |
Source: Public Records
Map
Nearby Homes
- 139 Brooklyn Ave
- 1718 Hester Ave
- 1828 W San Carlos St
- 2469 Olive Ave
- 1555 Calaveras Ave
- 1680 Hanchett Ave
- 354 Irving Ave
- 1660 Hanchett Ave
- 1484 Rosecrest Terrace
- 407 Raymond Ave
- 0 N Bascom Ave
- 425 Rutland Ave
- 371 Menker Ave
- 418 Vaughn Ave Unit 1 & 2
- 453 Arleta Ave
- 458 Laswell Ave
- 111 N Willard Ave
- 494 Clifton Ave
- 1317 Hester Ave
- 19 N Willard Ave
- 196 Forest Ave Unit 1
- 222 Wabash Ave
- 224 Wabash Ave
- 239 Wabash Ave
- 221 Wabash Ave
- 232 Wabash Ave
- 247 Wabash Ave
- 217 Wabash Ave
- 197 Wabash Ave
- 251 Wabash Ave
- 195 Wabash Ave
- 205 Wabash Ave
- 236 Wabash Ave
- 255 Wabash Ave
- 1810 Forest Ave
- 238 Wabash Ave
- 191 Wabash Ave
- 257 Wabash Ave
- 1851 Forest Ave Unit 1
- 238 Brooklyn Ave
Your Personal Tour Guide
Ask me questions while you tour the home.