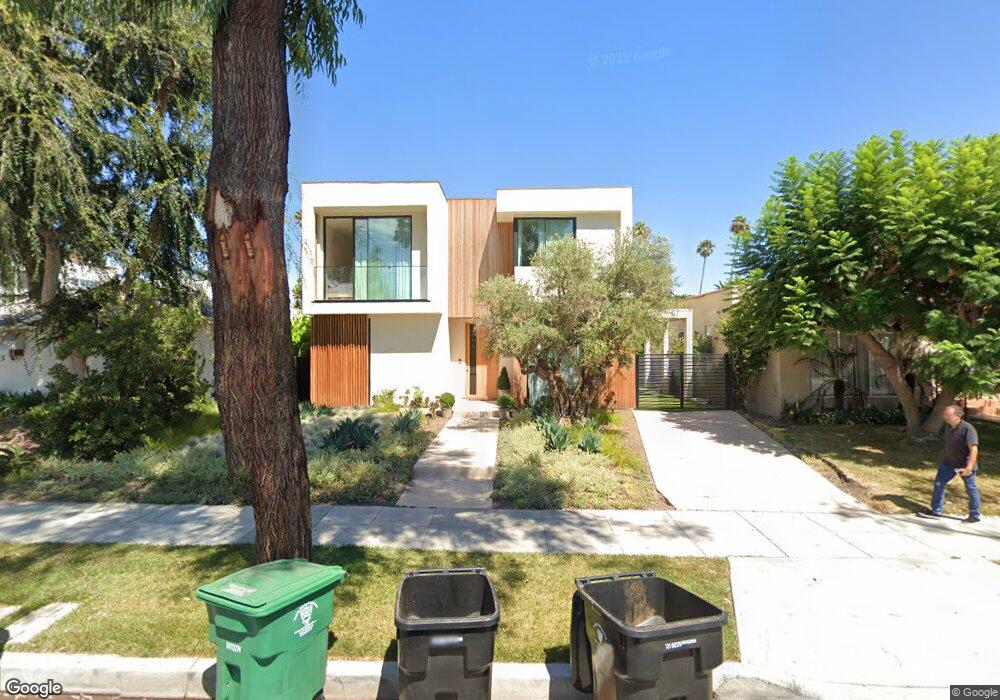
210 Willaman Dr Beverly Hills, CA 90211
Estimated Value: $2,639,000 - $4,096,809
3
Beds
4
Baths
1,461
Sq Ft
$2,371/Sq Ft
Est. Value
About This Home
This home is located at 210 Willaman Dr, Beverly Hills, CA 90211 and is currently estimated at $3,464,452, approximately $2,371 per square foot. 210 Willaman Dr is a home located in Los Angeles County with nearby schools including Horace Mann Elementary School, Beverly Hills High School, and Rabbi Jacob Pressman Academy.
Ownership History
Date
Name
Owned For
Owner Type
Purchase Details
Closed on
Jan 11, 2022
Sold by
210 Willaman Llc
Bought by
210 Willamanb Llc
Current Estimated Value
Purchase Details
Closed on
Oct 24, 2018
Sold by
Nehemia Yaniv
Bought by
210 Willaman Llc
Purchase Details
Closed on
Feb 2, 2017
Sold by
Gilboa Behemia Tal
Bought by
Nehemia Yaniv
Purchase Details
Closed on
Nov 1, 2016
Sold by
Davis Gerald D
Bought by
L & Y Enterprise
Purchase Details
Closed on
Mar 21, 2016
Sold by
Kay Jeffrey
Bought by
Bender Jill and Jill Bender Revocable Revocable Trust
Purchase Details
Closed on
Apr 1, 1994
Sold by
Davis Gerald D and Davis Arlene Spivak
Bought by
Davis Gerald D
Purchase Details
Closed on
Oct 14, 1993
Sold by
Davis Arlene Spivak
Bought by
Davis Gerald D
Create a Home Valuation Report for This Property
The Home Valuation Report is an in-depth analysis detailing your home's value as well as a comparison with similar homes in the area
Home Values in the Area
Average Home Value in this Area
Purchase History
| Date | Buyer | Sale Price | Title Company |
|---|---|---|---|
| 210 Willamanb Llc | -- | None Listed On Document | |
| 210 Willaman Llc | -- | Accommodation | |
| Nehemia Yaniv | -- | Accommodation | |
| Nehemia Yaniv | -- | Accommodation | |
| L & Y Enterprise | $1,895,000 | Equity Title Company | |
| Bender Jill | -- | Accommodation | |
| Davis Gerald D | -- | -- | |
| Davis Gerald D | -- | -- | |
| Davis Arlene Spivak | -- | -- | |
| Davis Gerald D | -- | -- | |
| Davis Gerald D | -- | -- | |
| Davis Gerald D | -- | -- | |
| Davis Arlene Spivak | -- | -- |
Source: Public Records
Tax History
| Year | Tax Paid | Tax Assessment Tax Assessment Total Assessment is a certain percentage of the fair market value that is determined by local assessors to be the total taxable value of land and additions on the property. | Land | Improvement |
|---|---|---|---|---|
| 2025 | $43,847 | $3,698,669 | $2,342,588 | $1,356,081 |
| 2024 | $43,847 | $3,626,147 | $2,296,655 | $1,329,492 |
| 2023 | $76,023 | $6,300,500 | $2,550,000 | $3,750,500 |
| 2022 | $26,470 | $2,253,724 | $2,207,474 | $46,250 |
| 2021 | $26,226 | $2,209,535 | $2,164,191 | $45,344 |
| 2019 | $23,436 | $1,971,557 | $1,577,246 | $394,311 |
| 2018 | $22,519 | $1,932,900 | $1,546,320 | $386,580 |
| 2016 | $1,767 | $143,285 | $101,643 | $41,642 |
| 2015 | $1,696 | $141,134 | $100,117 | $41,017 |
| 2014 | $1,655 | $138,370 | $98,156 | $40,214 |
Source: Public Records
Map
Nearby Homes
- 820 S Bedford St Unit 105
- 205 S Hamel Dr
- 828 S Bedford St Unit 202
- 8642 Gregory Way Unit 204
- 8642 Gregory Way Unit 202
- 869 S Wooster St Unit 103
- 140 N Carson Rd
- 918 S Wooster St Unit 1
- 918 S Wooster St Unit 2
- 225 S Hamilton Dr Unit 102
- 225 S Hamilton Dr Unit 107
- 915 S Wooster St
- 937 S Bedford St
- 143 N Arnaz Dr Unit 102
- 143 N Arnaz Dr Unit 304
- 1010 S Bedford St
- 112 N Hamilton Dr Unit 305
- 235 S Gale Dr Unit 102
- 137 N Hamilton Dr
- 1017 S Shenandoah St
- 210 S Willaman Dr
- 210 S Willaman Dr
- 212 S Willaman Dr
- 208 S Willaman Dr
- 214 S Willaman Dr
- 206 S Willaman Dr
- 211 S Carson Rd
- 213 S Carson Rd
- 209 S Carson Rd
- 216 S Willaman Dr
- 204 S Willaman Dr
- 215 S Carson Rd
- 207 S Carson Rd
- 211 S Willaman Dr
- 217 S Carson Rd
- 213 S Willaman Dr
- 218 S Willaman Dr
- 205 S Carson Rd
- 209 S Willaman Dr
- 202 S Willaman Dr
Your Personal Tour Guide
Ask me questions while you tour the home.