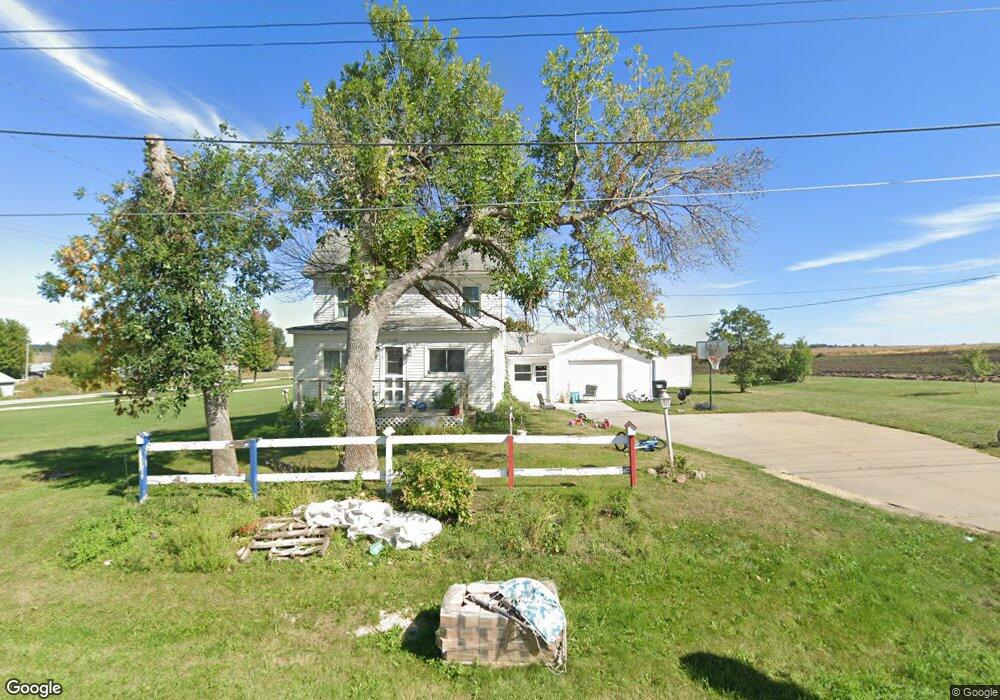
2100 2nd Ave Vinton, IA 52349
Estimated Value: $147,385 - $230,000
3
Beds
1
Bath
1,456
Sq Ft
$119/Sq Ft
Est. Value
About This Home
This home is located at 2100 2nd Ave, Vinton, IA 52349 and is currently estimated at $172,596, approximately $118 per square foot. 2100 2nd Ave is a home located in Benton County with nearby schools including Tilford Elementary School, Shellsburg Elementary School, and Vinton-Shellsburg Middle School.
Ownership History
Date
Name
Owned For
Owner Type
Purchase Details
Closed on
Apr 25, 2014
Sold by
The Estate Of James A Mcfarland
Bought by
Dague Alex T and Moritz Zadie M
Current Estimated Value
Home Financials for this Owner
Home Financials are based on the most recent Mortgage that was taken out on this home.
Original Mortgage
$79,591
Outstanding Balance
$60,481
Interest Rate
4.33%
Mortgage Type
New Conventional
Estimated Equity
$112,115
Create a Home Valuation Report for This Property
The Home Valuation Report is an in-depth analysis detailing your home's value as well as a comparison with similar homes in the area
Home Values in the Area
Average Home Value in this Area
Purchase History
| Date | Buyer | Sale Price | Title Company |
|---|---|---|---|
| Dague Alex T | $78,000 | None Available | |
| Dague Alex T | -- | None Available |
Source: Public Records
Mortgage History
| Date | Status | Borrower | Loan Amount |
|---|---|---|---|
| Open | Dague Alex T | $79,591 |
Source: Public Records
Tax History Compared to Growth
Tax History
| Year | Tax Paid | Tax Assessment Tax Assessment Total Assessment is a certain percentage of the fair market value that is determined by local assessors to be the total taxable value of land and additions on the property. | Land | Improvement |
|---|---|---|---|---|
| 2025 | $1,730 | $110,800 | $26,800 | $84,000 |
| 2024 | $1,730 | $102,500 | $27,300 | $75,200 |
| 2023 | $1,604 | $102,500 | $27,300 | $75,200 |
| 2022 | $1,644 | $83,400 | $21,800 | $61,600 |
| 2021 | $1,644 | $83,400 | $21,800 | $61,600 |
| 2020 | $1,476 | $77,000 | $12,600 | $64,400 |
| 2019 | $1,532 | $77,000 | $12,600 | $64,400 |
| 2018 | $1,484 | $78,400 | $16,400 | $62,000 |
| 2017 | $1,484 | $78,400 | $16,400 | $62,000 |
| 2016 | $1,392 | $73,200 | $15,300 | $57,900 |
| 2015 | $1,392 | $73,200 | $15,300 | $57,900 |
| 2014 | $1,252 | $66,600 | $0 | $0 |
Source: Public Records
Map
Nearby Homes