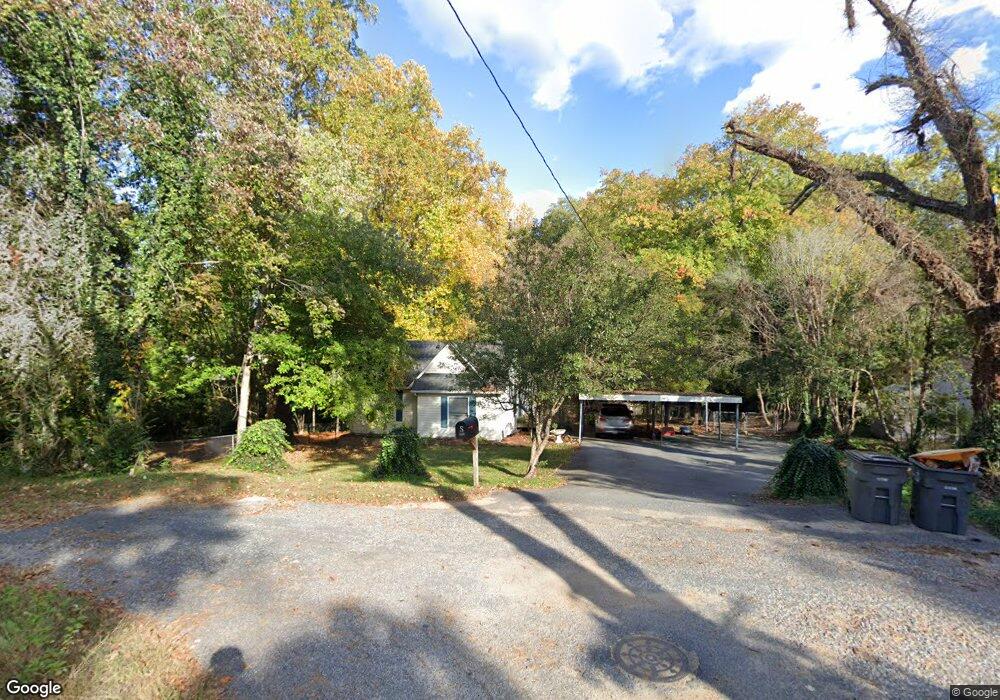
2100 Dyer St Kannapolis, NC 28083
Estimated Value: $210,000 - $280,484
3
Beds
2
Baths
1,268
Sq Ft
$194/Sq Ft
Est. Value
About This Home
This home is located at 2100 Dyer St, Kannapolis, NC 28083 and is currently estimated at $246,621, approximately $194 per square foot. 2100 Dyer St is a home located in Rowan County with nearby schools including North Kannapolis Elementary School, Kannapolis Middle, and A.L. Brown High School.
Ownership History
Date
Name
Owned For
Owner Type
Purchase Details
Closed on
Mar 16, 2023
Sold by
Smith Michael C
Bought by
Smith Sheelah Eller
Current Estimated Value
Home Financials for this Owner
Home Financials are based on the most recent Mortgage that was taken out on this home.
Original Mortgage
$42,000
Outstanding Balance
$40,679
Interest Rate
6.12%
Mortgage Type
New Conventional
Estimated Equity
$205,942
Purchase Details
Closed on
Oct 12, 2010
Sold by
Self Help Ventures Fund
Bought by
Smith Michael C and Eller Sheelah R
Home Financials for this Owner
Home Financials are based on the most recent Mortgage that was taken out on this home.
Original Mortgage
$66,900
Interest Rate
4.75%
Mortgage Type
New Conventional
Purchase Details
Closed on
Jun 22, 2010
Sold by
Medina Munoz Salvador
Bought by
Self Help Ventures Fund
Create a Home Valuation Report for This Property
The Home Valuation Report is an in-depth analysis detailing your home's value as well as a comparison with similar homes in the area
Home Values in the Area
Average Home Value in this Area
Purchase History
| Date | Buyer | Sale Price | Title Company |
|---|---|---|---|
| Smith Sheelah Eller | -- | -- | |
| Smith Michael C | $66,000 | None Available | |
| Self Help Ventures Fund | $57,800 | None Available |
Source: Public Records
Mortgage History
| Date | Status | Borrower | Loan Amount |
|---|---|---|---|
| Open | Smith Sheelah Eller | $42,000 | |
| Previous Owner | Smith Michael C | $66,900 |
Source: Public Records
Tax History Compared to Growth
Tax History
| Year | Tax Paid | Tax Assessment Tax Assessment Total Assessment is a certain percentage of the fair market value that is determined by local assessors to be the total taxable value of land and additions on the property. | Land | Improvement |
|---|---|---|---|---|
| 2025 | $2,138 | $176,693 | $47,565 | $129,128 |
| 2024 | $2,138 | $176,693 | $47,565 | $129,128 |
| 2023 | $2,138 | $176,693 | $47,565 | $129,128 |
| 2022 | $1,466 | $113,868 | $33,296 | $80,572 |
| 2021 | $1,466 | $113,868 | $33,296 | $80,572 |
| 2020 | $1,466 | $113,868 | $33,296 | $80,572 |
| 2019 | $1,466 | $113,868 | $33,296 | $80,572 |
| 2018 | $1,318 | $103,557 | $33,295 | $70,262 |
| 2017 | $1,318 | $103,557 | $33,295 | $70,262 |
| 2016 | $1,318 | $103,557 | $33,295 | $70,262 |
| 2015 | $1,338 | $103,557 | $33,295 | $70,262 |
| 2014 | $1,308 | $104,657 | $30,631 | $74,026 |
Source: Public Records
Map
Nearby Homes