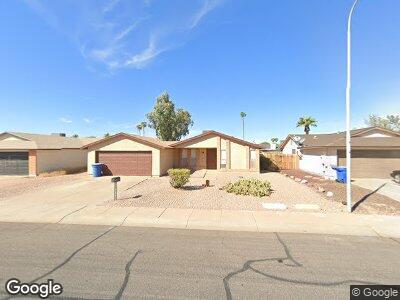
2100 N Comanche Dr Chandler, AZ 85224
Amberwood NeighborhoodEstimated Value: $376,483 - $444,000
4
Beds
2
Baths
1,422
Sq Ft
$288/Sq Ft
Est. Value
About This Home
This home is located at 2100 N Comanche Dr, Chandler, AZ 85224 and is currently estimated at $408,871, approximately $287 per square foot. 2100 N Comanche Dr is a home located in Maricopa County with nearby schools including Pomeroy Elementary School, Franklin at Brimhall Elementary School, and Summit Academy Elementary.
Ownership History
Date
Name
Owned For
Owner Type
Purchase Details
Closed on
Oct 30, 2024
Sold by
Alto Asset Company 2 Llc
Bought by
Montpelier Assets Llc
Current Estimated Value
Purchase Details
Closed on
Mar 4, 2020
Sold by
Luxor Sfr Spv 1 Llc
Bought by
Alto Asset Company 2 Llc
Purchase Details
Closed on
May 17, 2019
Sold by
Power Ranch Realty Llc
Bought by
Luxor Sfr Spv 1 Llc
Home Financials for this Owner
Home Financials are based on the most recent Mortgage that was taken out on this home.
Original Mortgage
$215,000,000
Interest Rate
4.1%
Mortgage Type
Construction
Purchase Details
Closed on
May 7, 2019
Sold by
Newman Joel
Bought by
Power Ranch Realty Llc
Home Financials for this Owner
Home Financials are based on the most recent Mortgage that was taken out on this home.
Original Mortgage
$215,000,000
Interest Rate
4.1%
Mortgage Type
Construction
Create a Home Valuation Report for This Property
The Home Valuation Report is an in-depth analysis detailing your home's value as well as a comparison with similar homes in the area
Home Values in the Area
Average Home Value in this Area
Purchase History
| Date | Buyer | Sale Price | Title Company |
|---|---|---|---|
| Montpelier Assets Llc | $30,181,678 | 7 Title | |
| Alto Asset Company 2 Llc | $31,416 | Bchh Inc | |
| Luxor Sfr Spv 1 Llc | $245,000 | Driggs Title Agency Inc | |
| Power Ranch Realty Llc | $226,163 | Driggs Title Agency Inc |
Source: Public Records
Mortgage History
| Date | Status | Borrower | Loan Amount |
|---|---|---|---|
| Previous Owner | Luxor Sfr Spv 1 Llc | $215,000,000 | |
| Previous Owner | Newman Joel | $150,000 |
Source: Public Records
Tax History Compared to Growth
Tax History
| Year | Tax Paid | Tax Assessment Tax Assessment Total Assessment is a certain percentage of the fair market value that is determined by local assessors to be the total taxable value of land and additions on the property. | Land | Improvement |
|---|---|---|---|---|
| 2025 | $1,566 | $15,615 | -- | -- |
| 2024 | $1,579 | $14,872 | -- | -- |
| 2023 | $1,579 | $32,550 | $6,510 | $26,040 |
| 2022 | $1,539 | $24,400 | $4,880 | $19,520 |
| 2021 | $1,529 | $21,470 | $4,290 | $17,180 |
| 2020 | $1,512 | $19,600 | $3,920 | $15,680 |
| 2019 | $1,406 | $17,960 | $3,590 | $14,370 |
| 2018 | $1,163 | $16,300 | $3,260 | $13,040 |
| 2017 | $1,118 | $15,030 | $3,000 | $12,030 |
| 2016 | $1,094 | $14,330 | $2,860 | $11,470 |
| 2015 | $1,029 | $14,120 | $2,820 | $11,300 |
Source: Public Records
Map
Nearby Homes
- 2201 N Comanche Dr Unit 1075
- 1913 N Verano Way
- 1860 N Comanche Dr
- 2006 N Arrowhead Dr
- 1153 W Mesquite St
- 1210 W Stottler Dr
- 822 W El Alba Way
- 876 W El Monte Place Unit 3
- 1302 W Estrella Dr
- 1714 N Pleasant Dr
- 806 W El Alba Way
- 1112 W Citation Dr
- 1708 N Burbank Ct
- 1511 W Mesquite St
- 1227 W Highland St
- 2016 N Pennington Dr
- 1631 N Comanche Dr
- 730 W El Alba Way
- 1120 W Barrow Dr
- 909 W Mesquite St
- 2100 N Comanche Dr
- 2014 N Comanche Dr
- 2102 N Comanche Dr
- 2103 N Verano Way
- 2012 N Comanche Dr
- 2104 N Comanche Dr
- 2105 N Verano Way
- 2101 N Verano Way
- 2107 N Verano Way
- 2017 N Verano Way
- 2106 N Comanche Dr
- 2010 N Comanche Dr
- 2109 N Verano Way
- 2015 N Verano Way
- 2108 N Comanche Dr
- 2104 N Verano Ct
- 2008 N Comanche Dr
- 2111 N Verano Way
- 2013 N Verano Way
- 2016 N Verano Way